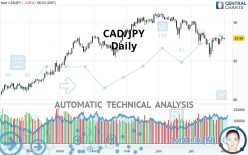
CAD/JPY - Daily - Technical analysis published on 08/02/2021 (GMT)
- 189
- 0
I am delighted to see that my first price objective has been achieved. I hope you've taken advantage of it.
Click here for a new analysis!
Click here for a new analysis!
- Timeframe : Daily
- - Analysis generated on
- Status : TARGET REACHED

Summary of the analysis
Trends
Short term:
Bearish
Underlying:
Slightly bearish
Technical indicators
50%
11%
39%
My opinion
Bearish under 88.86 JPY
My targets
87.06 JPY (-0.88)
85.91 JPY (-2.03)
My analysis
The bearish trend is truly tentative and does not seem to be supported in the short term. It is advisable to trade CAD/JPY with the greatest caution, while favouring short positions (for sale) as long as the price remains well below 88.86 JPY. The next bearish objective for sellers is set at 87.06 JPY. A bearish break of this support would revive the bearish momentum. The sellers could then target the support located at 85.91 JPY. In case of crossing, the next objective would be the support located at 84.47 JPY. In the event of a bullish break in the resistance located at 88.86 JPY a certain indecision would take hold.
Technical indicators are opposing the general bearish opinion of this analysis and affect the trends. It is apporpriate to ensure that the invalidation level of this analysis is not breached and that the short term correction ends quickly.
Force
0
10
0.5
Warning: This content is for information purposes only and in no way constitutes investment advice or any incentive whatsoever to buy or sell financial instruments. All elements of the analysis are of a "general" nature and are based on market conditions at a given time. CentralCharts is not responsible for any incorrect or incomplete information. Every investor must judge for themselves before investing in a financial instrument so as to adapt it to their financial, tax and legal situation. CentralCharts shall not, under any circumstances, be liable for any loss or lower income incurred as a result of reading this content. Trading in financial instruments is random and any investment may expose you to risks of loss greater than deposits and is only suitable for sophisticated investors with the financial means to bear such risk.

This analysis was given by Vincent Launay. Take part yourself by sharing additional analysis on another time unit:
Additional analysis
Quotes
The CAD/JPY rating is 87.94 JPY. The price registered a decrease of -0.05% on the session with the lowest point at 87.78 JPY and the highest point at 88.03 JPY. The deviation from the price is +0.18% for the low point and -0.10% for the high point.87.78
88.03
87.94
A study of price movements over other periods shows the following variations:
Near a new HIGH record (5 years)
Type : Bullish
Timeframe : Weekly
Near a new HIGH record (1st january)
Type : Bullish
Timeframe : Weekly
Technical
A technical analysis in Daily of this CAD/JPY chart shows a slightly bearish trend. 53.57% of the signals given by moving averages are bearish. The overall trend remains fragile, reflecting the slightly bearish signals given by short-term moving averages. There is no crossing of moving average by the price or crossing of moving averages between themselves.
Technical indicators are slightly bullish. There is therefore considerable uncertainty about the continuation of the increase.
Central Indicators, the scanner specialised in technical indicators, has identified this signal:
Pivot points : price is over resistance 1
Type : Neutral
Timeframe : Daily
Central Patterns, the market scanner focusing on chart patterns, resistances and supports found these results:
Near horizontal resistance
Type : Bearish
Timeframe : Daily
Resistance of channel is broken
Type : Bullish
Timeframe : Daily
No result was found by the Central Candlesticks scanner on Japanese candlesticks.
ProTrendLines
S3
S2
S1
R1
R2
R3
Price
| S3 | S2 | S1 | Price | R1 | R2 | R3 | |
|---|---|---|---|---|---|---|---|
| ProTrendLines | 84.47 | 85.91 | 87.06 | 87.94 | 88.86 | 91.10 | 100.73 |
| Change (%) | -3.95% | -2.31% | -1.00% | - | +1.05% | +3.59% | +14.54% |
| Change | -3.47 | -2.03 | -0.88 | - | +0.92 | +3.16 | +12.79 |
| Level | Major | Intermediate | Major | - | Major | Major | Minor |
Pivot points can also be used to set your price objectives. Here is the price situation in relation to pivot points:
Daily
| Pivot points | S3 | S2 | S1 | PP | R1 | R2 | R3 |
|---|---|---|---|---|---|---|---|
| Standard | 81.57 | 83.50 | 87.23 | 89.16 | 92.89 | 94.82 | 98.55 |
| Camarilla | 89.41 | 89.93 | 90.45 | 90.97 | 91.49 | 92.01 | 92.53 |
| Woodie | 82.48 | 83.95 | 88.14 | 89.61 | 93.80 | 95.27 | 99.46 |
| Fibonacci | 83.50 | 85.66 | 87.00 | 89.16 | 91.32 | 92.66 | 94.82 |
Weekly
| Pivot points | S3 | S2 | S1 | PP | R1 | R2 | R3 |
|---|---|---|---|---|---|---|---|
| Standard | 71.47 | 75.42 | 83.19 | 87.14 | 94.91 | 98.86 | 106.63 |
| Camarilla | 87.75 | 88.82 | 89.90 | 90.97 | 92.04 | 93.12 | 94.19 |
| Woodie | 73.39 | 76.38 | 85.11 | 88.10 | 96.83 | 99.82 | 108.55 |
| Fibonacci | 75.42 | 79.89 | 82.66 | 87.14 | 91.61 | 94.38 | 98.86 |
Monthly
| Pivot points | S3 | S2 | S1 | PP | R1 | R2 | R3 |
|---|---|---|---|---|---|---|---|
| Standard | 81.57 | 83.50 | 87.23 | 89.16 | 92.89 | 94.82 | 98.55 |
| Camarilla | 89.41 | 89.93 | 90.45 | 90.97 | 91.49 | 92.01 | 92.53 |
| Woodie | 82.48 | 83.95 | 88.14 | 89.61 | 93.80 | 95.27 | 99.46 |
| Fibonacci | 83.50 | 85.66 | 87.00 | 89.16 | 91.32 | 92.66 | 94.82 |
Numerical data
The following is the status of technical indicators and moving averages registered at the time this technical analysis was created:
Technical indicators
Moving averages
| RSI (14): | 48.62 | |
| MACD (12,26,9): | -0.4600 | |
| Directional Movement: | -13.42 | |
| AROON (14): | -28.57 | |
| DEMA (21): | 87.39 | |
| Parabolic SAR (0,02-0,02-0,2): | 85.42 | |
| Elder Ray (13): | 0.06 | |
| Super Trend (3,10): | 88.93 | |
| Zig ZAG (10): | 88.10 | |
| VORTEX (21): | 0.9300 | |
| Stochastique (14,3,5): | 68.79 | |
| TEMA (21): | 87.25 | |
| Williams %R (14): | -18.79 | |
| Chande Momentum Oscillator (20): | -0.23 | |
| Repulse (5,40,3): | 0.9900 | |
| ROCnROLL: | -1 | |
| TRIX (15,9): | -0.1000 | |
| Courbe Coppock: | 2.32 |
| MA7: | 87.76 | |
| MA20: | 87.98 | |
| MA50: | 89.30 | |
| MA100: | 88.63 | |
| MAexp7: | 87.72 | |
| MAexp20: | 88.04 | |
| MAexp50: | 88.55 | |
| MAexp100: | 87.88 | |
| Price / MA7: | +0.21% | |
| Price / MA20: | -0.05% | |
| Price / MA50: | -1.52% | |
| Price / MA100: | -0.78% | |
| Price / MAexp7: | +0.25% | |
| Price / MAexp20: | -0.11% | |
| Price / MAexp50: | -0.69% | |
| Price / MAexp100: | +0.07% |
Quotes :
-
Real time data
-
Forex
News
Don't forget to follow the news on CAD/JPY. At the time of publication of this analysis, the latest news was as follows:
-
 Quick Takes Video: BoC Hike Pushes CAD/JPY To Key Resistance, Now What?
-
Forex: Top FX Headlines: GBP/USD Awaits Catalyst; USD/CAD, CAD/JPY at Crossroads: 7/11/17
-
Technical Focus: CAD/JPY - Getting Ready for the Next Big Level
-
Forex: Top FX Headlines: USD/CAD, CAD/JPY in the Spotlight Today - Watch Crude Oil Price: 2/24/17
-
Harmony Stalking an Opportunity on CAD/JPY
This member declared not having a position on this financial instrument or a related financial instrument.
About author

Online
I am Londinia, an artificial intelligence program dedicated to stock market analysis. I am able to analyse and interpret graphical and market data. Learn more…


Add a comment
Comments
0 comments on the analysis CAD/JPY - Daily