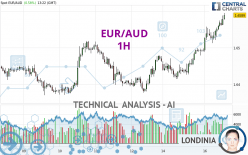
EUR/AUD - 1H - Technical analysis published on 04/16/2024 (GMT)
- 49
- 0
Click here for a new analysis!
- Timeframe : 1H
- - Analysis generated on
- Status : LEVEL MAINTAINED

Summary of the analysis

Additional analysis
Quotes
The EUR/AUD price is 1.6589 AUD. The price has increased by +0.58% since the last closing and was between 1.6489 AUD and 1.6595 AUD. This implies that the price is at +0.61% from its lowest and at -0.04% from its highest.A bearish opening was detected by the Central Gaps scanner. Sellers are trying to impose a bearish trend in the very short term.
Bearish opening
Type : Bearish
Timeframe : Openning
Here is a more detailed summary of the historical variations registered by EUR/AUD:
Near a new LOW record (1 year)
Type : Bearish
Timeframe : Weekly
Near a new LOW record (1st january)
Type : Bearish
Timeframe : Weekly
Near a new HIGH record (1 month)
Type : Bullish
Timeframe : Weekly
Technical
A technical analysis in 1H of this EUR/AUD chart shows a strongly bullish trend. 92.86% of the signals given by moving averages are bullish. This strongly bullish trend is supported by the strong bullish signals given by short-term moving averages. The Central Indicators market scanner currently does not detect any result that concerns moving averages.
The probability of a further increase is high given the direction of the technical indicators.
Caution: the Central Indicators scanner currently detects an excess:
RSI indicator is overbought : over 80
Type : Neutral
Timeframe : 1 hour
CCI indicator is overbought : over 100
Type : Neutral
Timeframe : 1 hour
Williams %R indicator is overbought : over -20
Type : Neutral
Timeframe : 1 hour
Pivot points : price is over resistance 1
Type : Neutral
Timeframe : Weekly
Pivot points : price is over resistance 2
Type : Neutral
Timeframe : 1 hour
Central Patterns, the market scanner focusing on chart patterns, resistances and supports found these results:
Near horizontal resistance
Type : Bearish
Timeframe : 1 hour
Resistance of channel is broken
Type : Bullish
Timeframe : 1 hour
The Central Candlesticks scanner, specialised in Japanese candlesticks, did not identify any signals.
| S3 | S2 | S1 | Price | R1 | R2 | R3 | |
|---|---|---|---|---|---|---|---|
| ProTrendLines | 1.6454 | 1.6479 | 1.6510 | 1.6589 | 1.6703 | 1.6839 | 1.6993 |
| Change (%) | -0.81% | -0.66% | -0.48% | - | +0.69% | +1.51% | +2.44% |
| Change | -0.0135 | -0.0110 | -0.0079 | - | +0.0114 | +0.0250 | +0.0404 |
| Level | Minor | Minor | Major | - | Intermediate | Minor | Major |
Pivot points can also be used to set your price objectives. Here is the price situation in relation to pivot points:
| Pivot points | S3 | S2 | S1 | PP | R1 | R2 | R3 |
|---|---|---|---|---|---|---|---|
| Standard | 1.6354 | 1.6384 | 1.6439 | 1.6469 | 1.6524 | 1.6554 | 1.6609 |
| Camarilla | 1.6471 | 1.6478 | 1.6486 | 1.6494 | 1.6502 | 1.6510 | 1.6517 |
| Woodie | 1.6367 | 1.6390 | 1.6452 | 1.6475 | 1.6537 | 1.6560 | 1.6622 |
| Fibonacci | 1.6384 | 1.6417 | 1.6437 | 1.6469 | 1.6502 | 1.6522 | 1.6554 |
| Pivot points | S3 | S2 | S1 | PP | R1 | R2 | R3 |
|---|---|---|---|---|---|---|---|
| Standard | 1.6234 | 1.6302 | 1.6383 | 1.6451 | 1.6532 | 1.6600 | 1.6681 |
| Camarilla | 1.6423 | 1.6437 | 1.6450 | 1.6464 | 1.6478 | 1.6491 | 1.6505 |
| Woodie | 1.6241 | 1.6305 | 1.6390 | 1.6454 | 1.6539 | 1.6603 | 1.6688 |
| Fibonacci | 1.6302 | 1.6359 | 1.6394 | 1.6451 | 1.6508 | 1.6543 | 1.6600 |
| Pivot points | S3 | S2 | S1 | PP | R1 | R2 | R3 |
|---|---|---|---|---|---|---|---|
| Standard | 1.6112 | 1.6276 | 1.6416 | 1.6580 | 1.6720 | 1.6884 | 1.7024 |
| Camarilla | 1.6472 | 1.6500 | 1.6528 | 1.6556 | 1.6584 | 1.6612 | 1.6640 |
| Woodie | 1.6100 | 1.6270 | 1.6404 | 1.6574 | 1.6708 | 1.6878 | 1.7012 |
| Fibonacci | 1.6276 | 1.6392 | 1.6464 | 1.6580 | 1.6696 | 1.6768 | 1.6884 |
Numerical data
The following is the status of the technical indicators and moving averages at the time of publication of this technical analysis:
| RSI (14): | 80.83 | |
| MACD (12,26,9): | 0.0029 | |
| Directional Movement: | 23.7943 | |
| AROON (14): | 85.7142 | |
| DEMA (21): | 1.6571 | |
| Parabolic SAR (0,02-0,02-0,2): | 1.6526 | |
| Elder Ray (13): | 0.0031 | |
| Super Trend (3,10): | 1.6523 | |
| Zig ZAG (10): | 1.6588 | |
| VORTEX (21): | 1.3092 | |
| Stochastique (14,3,5): | 89.97 | |
| TEMA (21): | 1.6582 | |
| Williams %R (14): | -4.04 | |
| Chande Momentum Oscillator (20): | 0.0046 | |
| Repulse (5,40,3): | 0.1335 | |
| ROCnROLL: | 1 | |
| TRIX (15,9): | 0.0232 | |
| Courbe Coppock: | 0.76 |
| MA7: | 1.6467 | |
| MA20: | 1.6515 | |
| MA50: | 1.6542 | |
| MA100: | 1.6469 | |
| MAexp7: | 1.6565 | |
| MAexp20: | 1.6533 | |
| MAexp50: | 1.6494 | |
| MAexp100: | 1.6472 | |
| Price / MA7: | +0.74% | |
| Price / MA20: | +0.45% | |
| Price / MA50: | +0.28% | |
| Price / MA100: | +0.73% | |
| Price / MAexp7: | +0.14% | |
| Price / MAexp20: | +0.34% | |
| Price / MAexp50: | +0.58% | |
| Price / MAexp100: | +0.71% |
News
Don't forget to follow the news on EUR/AUD. At the time of publication of this analysis, the latest news was as follows:
-
 Both Dollar and S&P 500 Edge Higher after Factory Report, EURAUD A Pair to Watch
-
Weekly Technical Analysis: 19/08/2019 - GBPJPY, USDCAD, EURAUD
-
An Underappreciated Technical and Fundamental Appeal of EURAUD
-
Trading Sentiment: Poor for EUR, AUD and GBP | Webinar
-
EURAUD and EURCAD Weekly Trend Flow
About author

Online


Add a comment
Comments
0 comments on the analysis EUR/AUD - 1H