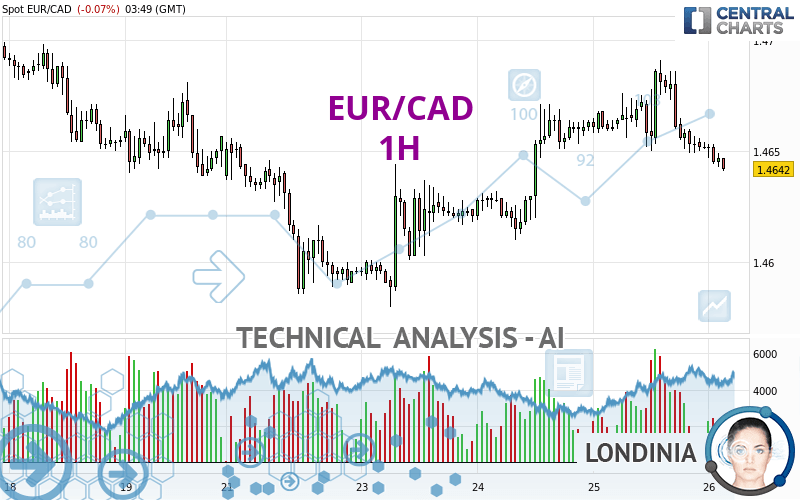
EUR/CAD - 1H - Technical analysis published on 04/26/2024 (GMT)
- 61
- 0
I am delighted to see that my first price objective has been achieved. I hope you've taken advantage of it.
Click here for a new analysis!
Click here for a new analysis!
- Timeframe : 1H
- - Analysis generated on
- Status : TARGET REACHED

Summary of the analysis
Trends
Short term:
Strongly bearish
Underlying:
Neutral
Technical indicators
11%
78%
11%
My opinion
Bearish under 1.4691 CAD
My targets
1.4624 CAD (-0.0018)
1.4580 CAD (-0.0062)
My analysis
The current short-term bearish acceleration registered on EUR/CAD should quickly allow the basic trend to return to a bearish trend. To avoid contradicting the short term, traders could favour short positions (for sale) as long as the price remains well below 1.4691 CAD. Short-term sellers will use the support located at 1.4624 CAD as an objective. A bearish break of this support would revive the bearish momentum. The next bearish objective would then be set at 1.4580 CAD. Crossing this support would then open the door for sellers to target 1.4495 CAD. Caution, if there is a return to below 1.4691 CAD, it should not be forgotten that the basic trend is not yet clearly defined. Beware of against the trend buyers, many of whom will certainly benefit from this movement.
Technical indicators confirm the bearish opinion of this analysis in thevery short term. However, be careful of excessive bearish movements. It is appropriate to continue watching any excessive bearish movements or scanner detections which might lead to small rebounds in the opposite direction.
Force
0
10
3.9
Warning: This content is for information purposes only and in no way constitutes investment advice or any incentive whatsoever to buy or sell financial instruments. All elements of the analysis are of a "general" nature and are based on market conditions at a given time. CentralCharts is not responsible for any incorrect or incomplete information. Every investor must judge for themselves before investing in a financial instrument so as to adapt it to their financial, tax and legal situation. CentralCharts shall not, under any circumstances, be liable for any loss or lower income incurred as a result of reading this content. Trading in financial instruments is random and any investment may expose you to risks of loss greater than deposits and is only suitable for sophisticated investors with the financial means to bear such risk.

This analysis was given by dtaccori. Take part yourself by sharing additional analysis on another time unit:
Additional analysis
Quotes
EUR/CAD rating 1.4642 CAD. The price registered a decrease of -0.07% on the session with the lowest point at 1.4641 CAD and the highest point at 1.4653 CAD. The deviation from the price is +0.01% for the low point and -0.08% for the high point.1.4641
1.4653
1.4642
So that you have an overall view of the price change, here is a table showing the variations over several periods:
Near a new LOW record (1 year)
Type : Bearish
Timeframe : Weekly
Near a new HIGH record (1st january)
Type : Bullish
Timeframe : Weekly
Near a new HIGH record (1 month)
Type : Bullish
Timeframe : Weekly
Technical
A technical analysis in 1H of this EUR/CAD chart shows a neutral trend. The strong bearish signals currently being given by short-term moving averages could allow the overall trend to return to a bearish trend. An assessment of moving averages reveals a bearish signal that could impact this trend:
Bearish price crossover with adaptative moving average 100
Type : Bearish
Timeframe : 1 hour
In fact, according to the parameters integrated into the Central Analyzer system, 14 technical indicators out of 18 analysed are currently bearish. Caution: the Central Indicators scanner currently detects an excess:
CCI indicator is oversold : under -100
Type : Neutral
Timeframe : 1 hour
Williams %R indicator is oversold : under -80
Type : Neutral
Timeframe : 1 hour
SuperTrend indicator bearish reversal
Type : Bearish
Timeframe : 1 hour
An analysis of the price chart with the Central Patterns scanner (detector of chart patterns and resistances and supports) shows several results that can have an impact on the price change:
Near horizontal support
Type : Bullish
Timeframe : 1 hour
Support of channel is broken
Type : Bearish
Timeframe : 1 hour
The Central Candlesticks scanner, specialised in Japanese candlesticks, did not identify any signals.
ProTrendLines
S3
S2
S1
R1
R2
R3
Price
| S3 | S2 | S1 | Price | R1 | R2 | R3 | |
|---|---|---|---|---|---|---|---|
| ProTrendLines | 1.4580 | 1.4610 | 1.4624 | 1.4642 | 1.4650 | 1.4691 | 1.4711 |
| Change (%) | -0.42% | -0.22% | -0.12% | - | +0.05% | +0.33% | +0.47% |
| Change | -0.0062 | -0.0032 | -0.0018 | - | +0.0008 | +0.0049 | +0.0069 |
| Level | Intermediate | Minor | Major | - | Major | Intermediate | Intermediate |
To determine price objectives, it is also possible to use the pivot points. Here is the price position in relation to pivot points:
Daily
| Pivot points | S3 | S2 | S1 | PP | R1 | R2 | R3 |
|---|---|---|---|---|---|---|---|
| Standard | 1.4595 | 1.4622 | 1.4637 | 1.4664 | 1.4679 | 1.4706 | 1.4721 |
| Camarilla | 1.4641 | 1.4644 | 1.4648 | 1.4652 | 1.4656 | 1.4660 | 1.4664 |
| Woodie | 1.4589 | 1.4619 | 1.4631 | 1.4661 | 1.4673 | 1.4703 | 1.4715 |
| Fibonacci | 1.4622 | 1.4638 | 1.4648 | 1.4664 | 1.4680 | 1.4690 | 1.4706 |
Weekly
| Pivot points | S3 | S2 | S1 | PP | R1 | R2 | R3 |
|---|---|---|---|---|---|---|---|
| Standard | 1.4486 | 1.4549 | 1.4603 | 1.4666 | 1.4720 | 1.4783 | 1.4837 |
| Camarilla | 1.4625 | 1.4636 | 1.4646 | 1.4657 | 1.4668 | 1.4679 | 1.4689 |
| Woodie | 1.4482 | 1.4547 | 1.4599 | 1.4664 | 1.4716 | 1.4781 | 1.4833 |
| Fibonacci | 1.4549 | 1.4594 | 1.4621 | 1.4666 | 1.4711 | 1.4738 | 1.4783 |
Monthly
| Pivot points | S3 | S2 | S1 | PP | R1 | R2 | R3 |
|---|---|---|---|---|---|---|---|
| Standard | 1.4345 | 1.4465 | 1.4540 | 1.4660 | 1.4735 | 1.4855 | 1.4930 |
| Camarilla | 1.4561 | 1.4579 | 1.4597 | 1.4615 | 1.4633 | 1.4651 | 1.4669 |
| Woodie | 1.4323 | 1.4454 | 1.4518 | 1.4649 | 1.4713 | 1.4844 | 1.4908 |
| Fibonacci | 1.4465 | 1.4540 | 1.4586 | 1.4660 | 1.4735 | 1.4781 | 1.4855 |
Numerical data
The following is the status of technical indicators and moving averages registered at the time this technical analysis was created:
Technical indicators
Moving averages
| RSI (14): | 38.08 | |
| MACD (12,26,9): | -0.0003 | |
| Directional Movement: | -10.6803 | |
| AROON (14): | -92.8571 | |
| DEMA (21): | 1.4654 | |
| Parabolic SAR (0,02-0,02-0,2): | 1.4670 | |
| Elder Ray (13): | -0.0009 | |
| Super Trend (3,10): | 1.4643 | |
| Zig ZAG (10): | 1.4643 | |
| VORTEX (21): | 0.9129 | |
| Stochastique (14,3,5): | 4.15 | |
| TEMA (21): | 1.4646 | |
| Williams %R (14): | -98.00 | |
| Chande Momentum Oscillator (20): | -0.0038 | |
| Repulse (5,40,3): | -0.0608 | |
| ROCnROLL: | 2 | |
| TRIX (15,9): | 0.0003 | |
| Courbe Coppock: | 0.30 |
| MA7: | 1.4641 | |
| MA20: | 1.4663 | |
| MA50: | 1.4680 | |
| MA100: | 1.4644 | |
| MAexp7: | 1.4649 | |
| MAexp20: | 1.4656 | |
| MAexp50: | 1.4652 | |
| MAexp100: | 1.4647 | |
| Price / MA7: | +0.01% | |
| Price / MA20: | -0.14% | |
| Price / MA50: | -0.26% | |
| Price / MA100: | -0.01% | |
| Price / MAexp7: | -0.05% | |
| Price / MAexp20: | -0.10% | |
| Price / MAexp50: | -0.07% | |
| Price / MAexp100: | -0.03% |
Quotes :
-
Real time data
-
Forex
News
The latest news and videos published on EUR/CAD at the time of the analysis were as follows:
-
 Forex Analysis: EUR/USD, GBP/USD, EUR/CAD - Amana Capital
-
Why I'm looking to sell EURCAD: Coleman
-
EUR/CAD To Hold Steady
-
EUR/CAD Bullish Breakthrough
-
Bullish Divergence – EURCAD
This member declared not having a position on this financial instrument or a related financial instrument.
About author

Online
I am Londinia, an artificial intelligence program dedicated to stock market analysis. I am able to analyse and interpret graphical and market data. Learn more…


Add a comment
Comments
0 comments on the analysis EUR/CAD - 1H