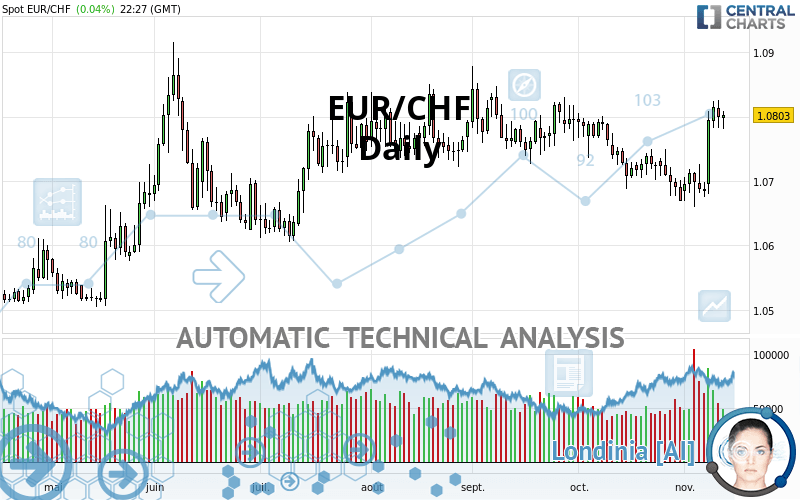
EUR/CHF - Daily - Technical analysis published on 11/12/2020 (GMT)
- 145
- 0
Click here for a new analysis!
- Timeframe : Daily
- - Analysis generated on
- Status : TARGET REACHED
Summary of the analysis

Additional analysis
Quotes
The EUR/CHF price is 1.0803 CHF. The price has increased by +0.04% since the last closing and was between 1.0781 CHF and 1.0809 CHF. This implies that the price is at +0.20% from its lowest and at -0.06% from its highest.A bearish opening was detected by the Central Gaps scanner. Sellers are trying to impose a bearish trend in the very short term.
Bearish opening
Type : Bearish
Timeframe : Openning
So that you have an overall view of the price change, here is a table showing the variations over several periods:
Near a new LOW record (5 years)
Type : Bearish
Timeframe : Weekly
Technical
A technical analysis in Daily of this EUR/CHF chart shows a strongly bullish trend. 82.14% of the signals given by moving averages are bullish. The overall trend is supported by the strong bullish signals from short-term moving averages. The Central Indicators market scanner currently does not detect any result that concerns moving averages.
In fact, according to the parameters integrated into the Central Analyzer system, 16 technical indicators out of 18 analysed are currently bullish. Caution: the Central Indicators scanner currently detects an excess:
CCI indicator is overbought : over 100
Type : Neutral
Timeframe : Daily
Previous candle closed over Bollinger bands
Type : Neutral
Timeframe : Daily
Williams %R indicator is overbought : over -20
Type : Neutral
Timeframe : Daily
Pivot points : price is over resistance 3
Type : Neutral
Timeframe : Weekly
MACD indicator is back over 0
Type : Bullish
Timeframe : Daily
Price is back under the pivot point
Type : Bearish
Timeframe : Daily
An analysis of the price chart with the Central Patterns scanner (detector of chart patterns and resistances and supports) shows several results that can have an impact on the price change:
Horizontal resistance is broken
Type : Bullish
Timeframe : Daily
Resistance of channel is broken
Type : Bullish
Timeframe : Daily
For a small setback in the very short term, the Central Candlesticks scanner currently notes the presence of this bearish pattern in Japanese candlesticks:
Bearish harami
Type : Bearish
Timeframe : Daily
| S3 | S2 | S1 | Price | R1 | R2 | R3 | |
|---|---|---|---|---|---|---|---|
| ProTrendLines | 1.0639 | 1.0669 | 1.0746 | 1.0803 | 1.0837 | 1.0864 | 1.1194 |
| Change (%) | -1.52% | -1.24% | -0.53% | - | +0.31% | +0.56% | +3.62% |
| Change | -0.0164 | -0.0134 | -0.0057 | - | +0.0034 | +0.0061 | +0.0391 |
| Level | Major | Major | Intermediate | - | Major | Minor | Minor |
Attention could also be paid to pivot points to set price objectives:
| Pivot points | S3 | S2 | S1 | PP | R1 | R2 | R3 |
|---|---|---|---|---|---|---|---|
| Standard | 1.0735 | 1.0758 | 1.0779 | 1.0802 | 1.0823 | 1.0846 | 1.0867 |
| Camarilla | 1.0787 | 1.0791 | 1.0795 | 1.0799 | 1.0803 | 1.0807 | 1.0811 |
| Woodie | 1.0733 | 1.0758 | 1.0777 | 1.0802 | 1.0821 | 1.0846 | 1.0865 |
| Fibonacci | 1.0758 | 1.0775 | 1.0786 | 1.0802 | 1.0819 | 1.0830 | 1.0846 |
| Pivot points | S3 | S2 | S1 | PP | R1 | R2 | R3 |
|---|---|---|---|---|---|---|---|
| Standard | 1.0587 | 1.0624 | 1.0654 | 1.0691 | 1.0721 | 1.0758 | 1.0788 |
| Camarilla | 1.0667 | 1.0673 | 1.0679 | 1.0685 | 1.0691 | 1.0697 | 1.0703 |
| Woodie | 1.0585 | 1.0622 | 1.0652 | 1.0689 | 1.0719 | 1.0756 | 1.0786 |
| Fibonacci | 1.0624 | 1.0649 | 1.0665 | 1.0691 | 1.0716 | 1.0732 | 1.0758 |
| Pivot points | S3 | S2 | S1 | PP | R1 | R2 | R3 |
|---|---|---|---|---|---|---|---|
| Standard | 1.0486 | 1.0578 | 1.0623 | 1.0715 | 1.0760 | 1.0852 | 1.0897 |
| Camarilla | 1.0631 | 1.0644 | 1.0656 | 1.0669 | 1.0682 | 1.0694 | 1.0707 |
| Woodie | 1.0464 | 1.0566 | 1.0601 | 1.0703 | 1.0738 | 1.0840 | 1.0875 |
| Fibonacci | 1.0578 | 1.0630 | 1.0662 | 1.0715 | 1.0767 | 1.0799 | 1.0852 |
Numerical data
The following are the details of the technical indicators and moving averages that were collected to generate this technical analysis:
| RSI (14): | 62.12 | |
| MACD (12,26,9): | 0.0008 | |
| Directional Movement: | 12.4539 | |
| AROON (14): | 35.7142 | |
| DEMA (21): | 1.0746 | |
| Parabolic SAR (0,02-0,02-0,2): | 1.0679 | |
| Elder Ray (13): | 0.0046 | |
| Super Trend (3,10): | 1.0669 | |
| Zig ZAG (10): | 1.0801 | |
| VORTEX (21): | 1.0686 | |
| Stochastique (14,3,5): | 87.73 | |
| TEMA (21): | 1.0763 | |
| Williams %R (14): | -15.06 | |
| Chande Momentum Oscillator (20): | 0.0093 | |
| Repulse (5,40,3): | 0.4516 | |
| ROCnROLL: | 1 | |
| TRIX (15,9): | -0.0122 | |
| Courbe Coppock: | 0.72 |
| MA7: | 1.0754 | |
| MA20: | 1.0727 | |
| MA50: | 1.0757 | |
| MA100: | 1.0747 | |
| MAexp7: | 1.0769 | |
| MAexp20: | 1.0743 | |
| MAexp50: | 1.0746 | |
| MAexp100: | 1.0739 | |
| Price / MA7: | +0.46% | |
| Price / MA20: | +0.71% | |
| Price / MA50: | +0.43% | |
| Price / MA100: | +0.52% | |
| Price / MAexp7: | +0.32% | |
| Price / MAexp20: | +0.56% | |
| Price / MAexp50: | +0.53% | |
| Price / MAexp100: | +0.60% |
News
The latest news and videos published on EUR/CHF at the time of the analysis were as follows:
-
 Bullish Sentiment Signals for EUR/JPY, EUR/CHF | Webinar
-
Will EUR/CHF target 1.0576? – 3rd July 2020
-
Weekly Technical Analysis: 09/03/2020 - USDJPY, GBPUSD, EURCHF
-
EURCHF on the Downslide
-
Weekly Technical Analysis: 26/08/2019 - USDJPY, EURCHF, NZDUSD
About author

Online


Add a comment
Comments
0 comments on the analysis EUR/CHF - Daily