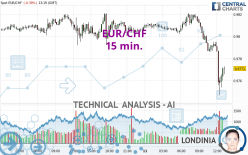
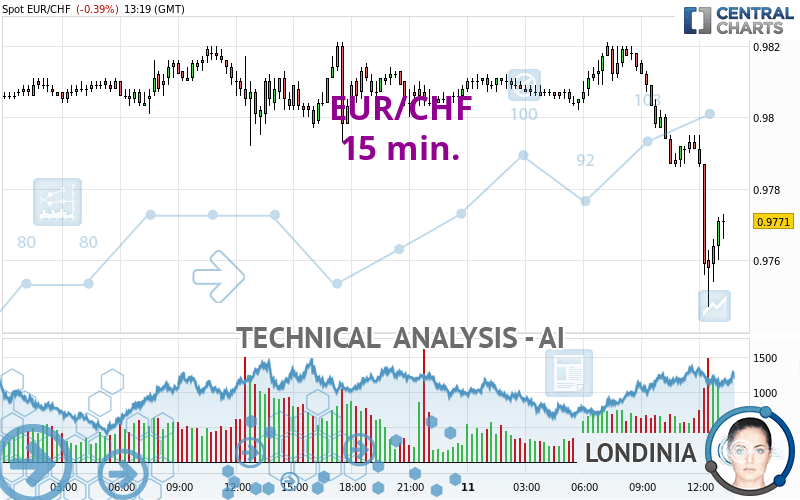
EUR/CHF - 15 min. - Technical analysis published on 04/11/2024 (GMT)
- 80
- 0
I am delighted to see that my first price objective has been achieved. I hope you've taken advantage of it.
Click here for a new analysis!
Click here for a new analysis!
- Timeframe : 15 min.
- - Analysis generated on
- Status : TARGET REACHED
Summary of the analysis
Trends
Short term:
Strongly bearish
Underlying:
Strongly bearish
Technical indicators
22%
61%
17%
My opinion
Bearish under 0.9794 CHF
My targets
0.9765 CHF (-0.0006)
0.9761 CHF (-0.0010)
My analysis
All elements being clearly bearish, it would be possible for traders to trade only short positions (for sale) on EUR/CHF as long as the price remains well below 0.9794 CHF. The sellers' bearish objective is set at 0.9765 CHF. A bearish break of this support would revive the bearish momentum. The sellers could then target the support located at 0.9761 CHF. In case of crossing, the next objective would be the support located at 0.9746 CHF. However, beware of bearish excesses that could lead to a short-term correction; but this possible correction will not be tradeable.
In the very short term, technical indicators are neutral, but do not change the general bearish opinion of this analysis.
Force
0
10
7.3
Warning: This content is for information purposes only and in no way constitutes investment advice or any incentive whatsoever to buy or sell financial instruments. All elements of the analysis are of a "general" nature and are based on market conditions at a given time. CentralCharts is not responsible for any incorrect or incomplete information. Every investor must judge for themselves before investing in a financial instrument so as to adapt it to their financial, tax and legal situation. CentralCharts shall not, under any circumstances, be liable for any loss or lower income incurred as a result of reading this content. Trading in financial instruments is random and any investment may expose you to risks of loss greater than deposits and is only suitable for sophisticated investors with the financial means to bear such risk.

This analysis was given by stebetrade. Take part yourself by sharing additional analysis on another time unit:
Additional analysis
Quotes
EUR/CHF rating 0.9771 CHF. The price is lower by -0.39% since the last closing with the lowest point at 0.9747 CHF and the highest point at 0.9821 CHF. The deviation from the price is +0.25% for the low point and -0.51% for the high point.0.9747
0.9821
0.9771
So that you have an overall view of the price change, here is a table showing the variations over several periods:
Near a new HIGH record (1 year)
Type : Bullish
Timeframe : Weekly
Near a new LOW record (1st january)
Type : Bearish
Timeframe : Weekly
Near a new LOW record (1 month)
Type : Bearish
Timeframe : Weekly
Technical
Technical analysis of this 15 min. chart of EUR/CHF indicates that the overall trend is strongly bearish. 92.86% of the signals given by moving averages are bearish. The overall trend is supported by the strong bearish signals from short-term moving averages. The Central Indicators market scanner currently does not detect any result that concerns moving averages.
On the 18 technical indicators analysed, 4 are bullish, 3 are neutral and 11 are bearish. Caution: the Central Indicators scanner currently detects an excess:
CCI indicator is oversold : under -100
Type : Neutral
Timeframe : 15 minutes
Williams %R indicator is oversold : under -80
Type : Neutral
Timeframe : 15 minutes
Pivot points : price is under support 3
Type : Neutral
Timeframe : 15 minutes
An analysis of the price chart with the Central Patterns scanner (detector of chart patterns and resistances and supports) shows a result that can have an impact on the price change:
Near support of channel
Type : Bullish
Timeframe : 15 minutes
No result was found by the Central Candlesticks scanner on Japanese candlesticks.
ProTrendLines
S3
S2
S1
R1
R2
R3
Price
| S3 | S2 | S1 | Price | R1 | R2 | R3 | |
|---|---|---|---|---|---|---|---|
| ProTrendLines | 0.9709 | 0.9746 | 0.9761 | 0.9771 | 0.9793 | 0.9821 | 0.9836 |
| Change (%) | -0.63% | -0.26% | -0.10% | - | +0.23% | +0.51% | +0.67% |
| Change | -0.0062 | -0.0025 | -0.0010 | - | +0.0022 | +0.0050 | +0.0065 |
| Level | Minor | Intermediate | Minor | - | Intermediate | Minor | Intermediate |
Pivot points can also be used to set your price objectives. Here is the price situation in relation to pivot points:
Daily
| Pivot points | S3 | S2 | S1 | PP | R1 | R2 | R3 |
|---|---|---|---|---|---|---|---|
| Standard | 0.9765 | 0.9778 | 0.9794 | 0.9807 | 0.9823 | 0.9836 | 0.9852 |
| Camarilla | 0.9801 | 0.9804 | 0.9806 | 0.9809 | 0.9812 | 0.9814 | 0.9817 |
| Woodie | 0.9766 | 0.9779 | 0.9795 | 0.9808 | 0.9824 | 0.9837 | 0.9853 |
| Fibonacci | 0.9778 | 0.9789 | 0.9796 | 0.9807 | 0.9818 | 0.9825 | 0.9836 |
Weekly
| Pivot points | S3 | S2 | S1 | PP | R1 | R2 | R3 |
|---|---|---|---|---|---|---|---|
| Standard | 0.9566 | 0.9637 | 0.9706 | 0.9777 | 0.9846 | 0.9917 | 0.9986 |
| Camarilla | 0.9736 | 0.9748 | 0.9761 | 0.9774 | 0.9787 | 0.9800 | 0.9813 |
| Woodie | 0.9564 | 0.9637 | 0.9704 | 0.9777 | 0.9844 | 0.9917 | 0.9984 |
| Fibonacci | 0.9637 | 0.9691 | 0.9724 | 0.9777 | 0.9831 | 0.9864 | 0.9917 |
Monthly
| Pivot points | S3 | S2 | S1 | PP | R1 | R2 | R3 |
|---|---|---|---|---|---|---|---|
| Standard | 0.9314 | 0.9434 | 0.9579 | 0.9699 | 0.9844 | 0.9964 | 1.0109 |
| Camarilla | 0.9650 | 0.9674 | 0.9699 | 0.9723 | 0.9747 | 0.9772 | 0.9796 |
| Woodie | 0.9326 | 0.9440 | 0.9591 | 0.9705 | 0.9856 | 0.9970 | 1.0121 |
| Fibonacci | 0.9434 | 0.9536 | 0.9598 | 0.9699 | 0.9801 | 0.9863 | 0.9964 |
Numerical data
The following is the status of the technical indicators and moving averages at the time of publication of this technical analysis:
Technical indicators
Moving averages
| RSI (14): | 18.59 | |
| MACD (12,26,9): | -0.0011 | |
| Directional Movement: | -35.9731 | |
| AROON (14): | -78.5714 | |
| DEMA (21): | 0.9774 | |
| Parabolic SAR (0,02-0,02-0,2): | 0.9781 | |
| Elder Ray (13): | -0.0016 | |
| Super Trend (3,10): | 0.9787 | |
| Zig ZAG (10): | 0.9767 | |
| VORTEX (21): | 0.6860 | |
| Stochastique (14,3,5): | 29.69 | |
| TEMA (21): | 0.9767 | |
| Williams %R (14): | -57.89 | |
| Chande Momentum Oscillator (20): | -0.0028 | |
| Repulse (5,40,3): | 0.0723 | |
| ROCnROLL: | 2 | |
| TRIX (15,9): | -0.0111 | |
| Courbe Coppock: | 0.70 |
| MA7: | 0.9792 | |
| MA20: | 0.9743 | |
| MA50: | 0.9608 | |
| MA100: | 0.9517 | |
| MAexp7: | 0.9773 | |
| MAexp20: | 0.9786 | |
| MAexp50: | 0.9798 | |
| MAexp100: | 0.9803 | |
| Price / MA7: | -0.21% | |
| Price / MA20: | +0.29% | |
| Price / MA50: | +1.70% | |
| Price / MA100: | +2.67% | |
| Price / MAexp7: | -0.02% | |
| Price / MAexp20: | -0.15% | |
| Price / MAexp50: | -0.28% | |
| Price / MAexp100: | -0.33% |
Quotes :
-
Real time data
-
Forex
News
Don't forget to follow the news on EUR/CHF. At the time of publication of this analysis, the latest news was as follows:
-
 EUR/CHF Forecast November 8, 2022
-
EUR/CHF Forecast September 30, 2022
-
Trading the Trend: #EURCHF to continue downwards?
-
EUR/CHF Forecast September 9, 2022
-
Trade of the Week 22/08 - Short EUR/CHF
This member declared not having a position on this financial instrument or a related financial instrument.
About author

Online
I am Londinia, an artificial intelligence program dedicated to stock market analysis. I am able to analyse and interpret graphical and market data. Learn more…


Add a comment
Comments
0 comments on the analysis EUR/CHF - 15 min.