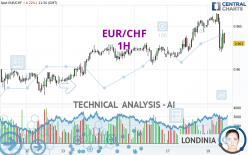
EUR/CHF - 1H - Technical analysis published on 03/19/2024 (GMT)
- 88
- 0
Click here for a new analysis!
- Timeframe : 1H
- - Analysis generated on
- Status : LEVEL MAINTAINED

Summary of the analysis

Additional analysis
Quotes
The EUR/CHF rating is 0.9631 CHF. On the day, this instrument lost -0.21% and was between 0.9620 CHF and 0.9665 CHF. This implies that the price is at +0.11% from its lowest and at -0.35% from its highest.Here is a more detailed summary of the historical variations registered by EUR/CHF:
Near a new LOW record (5 years)
Type : Bearish
Timeframe : Weekly
Near a new LOW record (1 year)
Type : Bearish
Timeframe : Weekly
New HIGH record (1st january)
Type : Bullish
Timeframe : Weekly
New HIGH record (1 month)
Type : Bullish
Timeframe : Weekly
Technical
Technical analysis of this 1H chart of EUR/CHF indicates that the overall trend is slightly bullish. 57.14% of the signals given by moving averages are bullish. Caution: the strong bearish signals currently being given by short-term moving averages indicate that this slightly bullish trend could be reversed. The Central Indicators scanner detects bullish and bearish signals on moving averages that could impact this trend:
Bullish trend reversal : adaptative moving average 100
Type : Bullish
Timeframe : 1 hour
Bearish price crossover with adaptative moving average 50
Type : Bearish
Timeframe : 1 hour
Bearish price crossover with adaptative moving average 100
Type : Bearish
Timeframe : 1 hour
An assessment of technical indicators shows a bearish signal.
Caution: the Central Indicators scanner currently detects an excess:
CCI indicator is oversold : under -100
Type : Neutral
Timeframe : 1 hour
Price is back under the pivot point
Type : Bearish
Timeframe : 1 hour
An analysis of the price chart with the Central Patterns scanner (detector of chart patterns and resistances and supports) shows several results that can have an impact on the price change:
Near horizontal support
Type : Bullish
Timeframe : 1 hour
Support of channel is broken
Type : Bearish
Timeframe : 1 hour
The Central Candlesticks scanner, specialised in Japanese candlesticks, did not identify any signals.
| S3 | S2 | S1 | Price | R1 | R2 | R3 | |
|---|---|---|---|---|---|---|---|
| ProTrendLines | 0.9576 | 0.9605 | 0.9629 | 0.9631 | 0.9680 | 0.9761 | 0.9810 |
| Change (%) | -0.57% | -0.27% | -0.02% | - | +0.51% | +1.35% | +1.86% |
| Change | -0.0055 | -0.0026 | -0.0002 | - | +0.0049 | +0.0130 | +0.0179 |
| Level | Minor | Major | Intermediate | - | Major | Minor | Minor |
Attention could also be paid to pivot points to set price objectives:
| Pivot points | S3 | S2 | S1 | PP | R1 | R2 | R3 |
|---|---|---|---|---|---|---|---|
| Standard | 0.9580 | 0.9596 | 0.9624 | 0.9640 | 0.9668 | 0.9684 | 0.9712 |
| Camarilla | 0.9639 | 0.9643 | 0.9647 | 0.9651 | 0.9655 | 0.9659 | 0.9663 |
| Woodie | 0.9585 | 0.9599 | 0.9629 | 0.9643 | 0.9673 | 0.9687 | 0.9717 |
| Fibonacci | 0.9596 | 0.9613 | 0.9624 | 0.9640 | 0.9657 | 0.9668 | 0.9684 |
| Pivot points | S3 | S2 | S1 | PP | R1 | R2 | R3 |
|---|---|---|---|---|---|---|---|
| Standard | 0.9521 | 0.9545 | 0.9582 | 0.9606 | 0.9643 | 0.9667 | 0.9704 |
| Camarilla | 0.9601 | 0.9607 | 0.9612 | 0.9618 | 0.9624 | 0.9629 | 0.9635 |
| Woodie | 0.9527 | 0.9548 | 0.9588 | 0.9609 | 0.9649 | 0.9670 | 0.9710 |
| Fibonacci | 0.9545 | 0.9569 | 0.9583 | 0.9606 | 0.9630 | 0.9644 | 0.9667 |
| Pivot points | S3 | S2 | S1 | PP | R1 | R2 | R3 |
|---|---|---|---|---|---|---|---|
| Standard | 0.9136 | 0.9222 | 0.9389 | 0.9475 | 0.9642 | 0.9728 | 0.9895 |
| Camarilla | 0.9487 | 0.9511 | 0.9534 | 0.9557 | 0.9580 | 0.9603 | 0.9627 |
| Woodie | 0.9178 | 0.9242 | 0.9431 | 0.9495 | 0.9684 | 0.9748 | 0.9937 |
| Fibonacci | 0.9222 | 0.9318 | 0.9378 | 0.9475 | 0.9571 | 0.9631 | 0.9728 |
Numerical data
The following are the details of the technical indicators and moving averages that were collected to generate this technical analysis:
| RSI (14): | 44.96 | |
| MACD (12,26,9): | 0.0001 | |
| Directional Movement: | -4.8133 | |
| AROON (14): | -21.4286 | |
| DEMA (21): | 0.9647 | |
| Parabolic SAR (0,02-0,02-0,2): | 0.9661 | |
| Elder Ray (13): | -0.0008 | |
| Super Trend (3,10): | 0.9663 | |
| Zig ZAG (10): | 0.9633 | |
| VORTEX (21): | 0.9954 | |
| Stochastique (14,3,5): | 27.41 | |
| TEMA (21): | 0.9642 | |
| Williams %R (14): | -71.11 | |
| Chande Momentum Oscillator (20): | -0.0018 | |
| Repulse (5,40,3): | -0.1298 | |
| ROCnROLL: | 2 | |
| TRIX (15,9): | 0.0078 | |
| Courbe Coppock: | 0.20 |
| MA7: | 0.9618 | |
| MA20: | 0.9583 | |
| MA50: | 0.9478 | |
| MA100: | 0.9495 | |
| MAexp7: | 0.9640 | |
| MAexp20: | 0.9644 | |
| MAexp50: | 0.9637 | |
| MAexp100: | 0.9627 | |
| Price / MA7: | +0.14% | |
| Price / MA20: | +0.50% | |
| Price / MA50: | +1.61% | |
| Price / MA100: | +1.43% | |
| Price / MAexp7: | -0.09% | |
| Price / MAexp20: | -0.13% | |
| Price / MAexp50: | -0.06% | |
| Price / MAexp100: | +0.04% |
News
Don't forget to follow the news on EUR/CHF. At the time of publication of this analysis, the latest news was as follows:
-
 EUR/CHF Forecast November 8, 2022
-
EUR/CHF Forecast September 30, 2022
-
Trading the Trend: #EURCHF to continue downwards?
-
EUR/CHF Forecast September 9, 2022
-
Trade of the Week 22/08 - Short EUR/CHF
About author

Online


Add a comment
Comments
0 comments on the analysis EUR/CHF - 1H