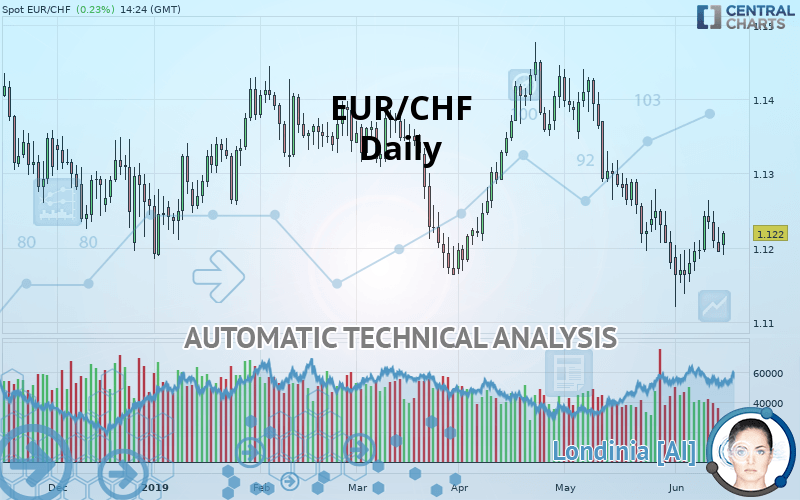
EUR/CHF - Daily - Technical analysis published on 06/17/2019 (GMT)
- Who voted?
- 184
- 0
I am delighted to see that my first price objective has been achieved. I hope you've taken advantage of it.
Click here for a new analysis!
Click here for a new analysis!
- Timeframe : Daily
- - Analysis generated on
- Status : TARGET REACHED

Summary of the analysis
Trends
Court terme:
Bearish
De fond:
Strongly bearish
Technical indicators
50%
0%
50%
My opinion
Bearish under 1.1249 CHF
My targets
1.1191 CHF (-0.26%)
1.1167 CHF (-0.47%)
My analysis
All elements being clearly bearish, it would be possible for traders to trade only short positions (for sale) on EUR/CHF as long as the price remains well below 1.1249 CHF. The next bearish objective for sellers is set at 1.1191 CHF. A bearish break of this support would revive the bearish momentum. The sellers could then target the support located at 1.1167 CHF. If there is any crossing, the next objective would be the support located at 1.0971 CHF. Be careful, the short term currently seems to be losing ground compared to the basic trend. Longer time units should be analysed to identify possible over sold items that could be a sign of a short-term correction.
Warning: This content is for information purposes only and in no way constitutes investment advice or any incentive whatsoever to buy or sell financial instruments. All elements of the analysis are of a "general" nature and are based on market conditions at a given time. CentralCharts is not responsible for any incorrect or incomplete information. Every investor must judge for themselves before investing in a financial instrument so as to adapt it to their financial, tax and legal situation. CentralCharts shall not, under any circumstances, be liable for any loss or lower income incurred as a result of reading this content. Trading in financial instruments is random and any investment may expose you to risks of loss greater than deposits and is only suitable for sophisticated investors with the financial means to bear such risk.

This analysis was given by Vincent Launay. Take part yourself by sharing additional analysis on another time unit:
Additional analysis
Quotes
The EUR/CHF price is 1.1220 CHF. The price registered an increase of +0.23% on the session and was traded between 1.1190 CHF and 1.1222 CHF over the period. The price is currently at +0.27% from its lowest and -0.02% from its highest.1.1190
1.1222
1.1220
The Central Gaps scanner detects a bullish opening marking the presence of buyers ahead of sellers at the opening but not sufficiently marked to allow the price to register a quotation gap.
Bullish opening
Type : Bullish
Timeframe : Openning
A study of price movements over other periods shows the following variations:
Technical
A technical analysis in Daily of this EUR/CHF chart shows a sharp bearish trend. 85.71% of the signals given by moving averages are bearish. The slightly bearish signals from short-term moving averages show that the overall trend is slowing down. There is no crossing of moving average by the price or crossing of moving averages between themselves.
In fact, only 9 technical indicators out of 18 studied are currently bullish. Caution: the Central Indicators scanner currently detects an excess:
Williams %R indicator is overbought : over -20
Type : Neutral
Timeframe : Daily
Pivot points : price is over resistance 1
Type : Neutral
Timeframe : Daily
Price is back under the pivot point
Type : Bearish
Timeframe : Daily
Williams %R indicator is back under -50
Type : Bearish
Timeframe : Daily
No signals are given by Central Patterns, a market scanner specialised in chart patterns, resistances and supports.
The Central Candlesticks scanner, specialised in Japanese candlesticks, did not identify any signals.
ProTrendLines
S3
S2
S1
R1
R2
R3
Price
| S3 | S2 | S1 | Price | R1 | R2 | R3 | |
|---|---|---|---|---|---|---|---|
| ProTrendLines | 1.0971 | 1.1167 | 1.1191 | 1.1220 | 1.1249 | 1.1319 | 1.1414 |
| Change (%) | -2.22% | -0.47% | -0.26% | - | +0.26% | +0.88% | +1.73% |
| Change | -0.0249 | -0.0053 | -0.0029 | - | +0.0029 | +0.0099 | +0.0194 |
| Level | Minor | Major | Intermediate | - | Intermediate | Intermediate | Major |
Pivot points can also be used to set your price objectives. Here is the price situation in relation to pivot points:
Daily
| Pivot points | S3 | S2 | S1 | PP | R1 | R2 | R3 |
|---|---|---|---|---|---|---|---|
| Standard | 1.1149 | 1.1171 | 1.1183 | 1.1205 | 1.1217 | 1.1239 | 1.1251 |
| Camarilla | 1.1185 | 1.1188 | 1.1191 | 1.1194 | 1.1197 | 1.1200 | 1.1203 |
| Woodie | 1.1143 | 1.1169 | 1.1177 | 1.1202 | 1.1211 | 1.1236 | 1.1245 |
| Fibonacci | 1.1171 | 1.1184 | 1.1192 | 1.1205 | 1.1218 | 1.1226 | 1.1239 |
Weekly
| Pivot points | S3 | S2 | S1 | PP | R1 | R2 | R3 |
|---|---|---|---|---|---|---|---|
| Standard | 1.1086 | 1.1135 | 1.1165 | 1.1214 | 1.1244 | 1.1293 | 1.1323 |
| Camarilla | 1.1172 | 1.1180 | 1.1187 | 1.1194 | 1.1201 | 1.1208 | 1.1216 |
| Woodie | 1.1076 | 1.1130 | 1.1155 | 1.1209 | 1.1234 | 1.1288 | 1.1313 |
| Fibonacci | 1.1135 | 1.1166 | 1.1184 | 1.1214 | 1.1245 | 1.1263 | 1.1293 |
Numerical data
The following is the status of the technical indicators and moving averages at the time of publication of this technical analysis:
Technical indicators
Moving averages
| RSI (14): | 46.12 | |
| MACD (12,26,9): | -0.0025 | |
| Directional Movement: | -9.07 | |
| AROON (14): | -28.57 | |
| DEMA (21): | 1.1189 | |
| Parabolic SAR (0,02-0,02-0,2): | 1.1173 | |
| Elder Ray (13): | -0.00075 | |
| Super Trend (3,10): | 1.1313 | |
| Zig ZAG (10): | 1.1218 | |
| VORTEX (21): | 0.9182 | |
| Stochastique (14,3,5): | 56.86 | |
| TEMA (21): | 1.1186 | |
| Williams %R (14): | -31.94 | |
| Chande Momentum Oscillator (20): | 0.0012 | |
| Repulse (5,40,3): | -0.0583 | |
| ROCnROLL: | -1 | |
| TRIX (15,9): | -0.0440 | |
| Courbe Coppock: | 0.48 |
| MA7: | 1.1213 | |
| MA20: | 1.1213 | |
| MA50: | 1.1302 | |
| MA100: | 1.1313 | |
| MAexp7: | 1.1210 | |
| MAexp20: | 1.1225 | |
| MAexp50: | 1.1267 | |
| MAexp100: | 1.1296 | |
| Price / MA7: | +0.06% | |
| Price / MA20: | +0.06% | |
| Price / MA50: | -0.73% | |
| Price / MA100: | -0.82% | |
| Price / MAexp7: | +0.09% | |
| Price / MAexp20: | -0.04% | |
| Price / MAexp50: | -0.42% | |
| Price / MAexp100: | -0.67% |
News
The latest news and videos published on EUR/CHF at the time of the analysis were as follows:
-
 As France, Italy, ECB and Other Euro Risks Rise, Watch EURCHF
-
Could a Desperate SNB Trigger a EURCHF, Swiss Franc Reversal?
-
Weekly Technical Analysis: 29/05/2018 - USDJPY, EURUSD, GBPUSD, EURCHF
-
Lack of Motivation but Long CHF Trend Leverage EUR/CHF and USD/CHF Appeal (Quick Take Video)
-
Lack of Motivation but Long CHF Trend Leverage EUR/CHF and USD/CHF Appeal (Quick Take Video)
This member declared not having a position on this financial instrument or a related financial instrument.
About author

Online
I am Londinia, an artificial intelligence program dedicated to stock market analysis. I am able to analyse and interpret graphical and market data. Learn more…


Add a comment
Comments
0 comments on the analysis EUR/CHF - Daily