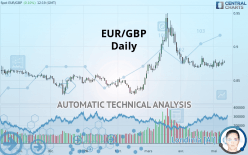
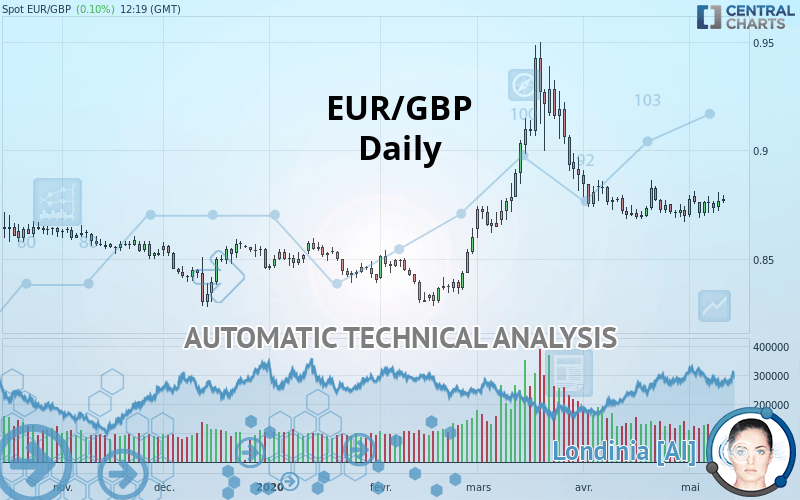
EUR/GBP - Daily - Technical analysis published on 05/12/2020 (GMT)
- Who voted?
- 219
- 0
I am delighted to see that my first price objective has been achieved. I hope you've taken advantage of it.
Click here for a new analysis!
Click here for a new analysis!
- Timeframe : Daily
- - Analysis generated on
- Status : TARGET REACHED
Summary of the analysis
Trends
Court terme:
Bullish
De fond:
Strongly bullish
Technical indicators
72%
0%
28%
My opinion
Bullish above 0.8634 GBP
My targets
0.8930 GBP (+0.0155)
0.9041 GBP (+0.0266)
My analysis
The basic bullish trend is very strong on EUR/GBP but the short term shows some signs of running out of steam. However, a purchase could be considered as long as the price remains above 0.8634 GBP. Crossing the first resistance at 0.8930 GBP would be a sign of a potential new surge in the price. Buyers would then use the next resistance located at 0.9041 GBP as an objective. Crossing it would then enable buyers to target 0.9310 GBP. Caution, a return to below 0.8634 GBP would be a sign of a consolidation phase in the short-term basic trend. If this is the case, remember that trading against the trend may be riskier. It would seem more appropriate to wait for a signal indicating reversal of the trend.
In the very short term, the general bullish sentiment is confirmed by technical indicators. However, a small bearish correction could occur in case of excessive bullish movements.
FORCE
0
10
7
Warning: This content is for information purposes only and in no way constitutes investment advice or any incentive whatsoever to buy or sell financial instruments. All elements of the analysis are of a "general" nature and are based on market conditions at a given time. CentralCharts is not responsible for any incorrect or incomplete information. Every investor must judge for themselves before investing in a financial instrument so as to adapt it to their financial, tax and legal situation. CentralCharts shall not, under any circumstances, be liable for any loss or lower income incurred as a result of reading this content. Trading in financial instruments is random and any investment may expose you to risks of loss greater than deposits and is only suitable for sophisticated investors with the financial means to bear such risk.

This analysis was given by Vincent Launay. Take part yourself by sharing additional analysis on another time unit:
Additional analysis
Quotes
EUR/GBP rating 0.8775 GBP. On the day, this instrument gained +0.10% and was traded between 0.8758 GBP and 0.8793 GBP over the period. The price is currently at +0.19% from its lowest and -0.20% from its highest.0.8758
0.8793
0.8775
Here is a more detailed summary of the historical variations registered by EUR/GBP:
Technical
Technical analysis of EUR/GBP in Daily shows a strongly overall bullish trend. 82.14% of the signals given by moving averages are bullish. The slightly bullish signals given by the short-term moving averages show a weakening of the global trend. An assessment of moving averages reveals several bullish signals that could impact this trend:
Bullish trend reversal : Moving Average 20
Type : Bullish
Timeframe : Daily
Bullish trend reversal : adaptative moving average 20
Type : Bullish
Timeframe : Daily
Technical indicators are strongly bullish, suggesting that the price increase should continue.
But beware of excesses. The Central Indicators scanner currently detects this:
Williams %R indicator is overbought : over -20
Type : Neutral
Timeframe : Daily
RSI indicator is back over 50
Type : Bullish
Timeframe : Daily
Price is back over the pivot point
Type : Bullish
Timeframe : Daily
Price is back under the pivot point
Type : Bearish
Timeframe : Weekly
Momentum indicator is back over 0
Type : Bullish
Timeframe : Daily
Williams %R indicator is back over -50
Type : Bullish
Timeframe : Daily
Central Patterns, the scanner specializing in chart patterns, did not identify any signals.
The Central Candlesticks scanner which studies Japanese candlesticks did not detect anything.
ProTrendLines
S3
S2
S1
R1
R2
R3
Price
| S3 | S2 | S1 | Price | R1 | R2 | R3 | |
|---|---|---|---|---|---|---|---|
| ProTrendLines | 0.8501 | 0.8634 | 0.8761 | 0.8775 | 0.8930 | 0.9041 | 0.9310 |
| Change (%) | -3.12% | -1.61% | -0.16% | - | +1.77% | +3.03% | +6.10% |
| Change | -0.0274 | -0.0141 | -0.0014 | - | +0.0155 | +0.0266 | +0.0535 |
| Level | Intermediate | Intermediate | Major | - | Intermediate | Major | Major |
Attention could also be paid to pivot points to set price objectives:
Daily
| Pivot points | S3 | S2 | S1 | PP | R1 | R2 | R3 |
|---|---|---|---|---|---|---|---|
| Standard | 0.8635 | 0.8677 | 0.8722 | 0.8764 | 0.8809 | 0.8851 | 0.8896 |
| Camarilla | 0.8742 | 0.8750 | 0.8758 | 0.8766 | 0.8774 | 0.8782 | 0.8790 |
| Woodie | 0.8636 | 0.8678 | 0.8723 | 0.8765 | 0.8810 | 0.8852 | 0.8897 |
| Fibonacci | 0.8677 | 0.8711 | 0.8731 | 0.8764 | 0.8798 | 0.8818 | 0.8851 |
Weekly
| Pivot points | S3 | S2 | S1 | PP | R1 | R2 | R3 |
|---|---|---|---|---|---|---|---|
| Standard | 0.8554 | 0.8622 | 0.8679 | 0.8747 | 0.8804 | 0.8872 | 0.8929 |
| Camarilla | 0.8702 | 0.8713 | 0.8725 | 0.8736 | 0.8748 | 0.8759 | 0.8770 |
| Woodie | 0.8549 | 0.8619 | 0.8674 | 0.8744 | 0.8799 | 0.8869 | 0.8924 |
| Fibonacci | 0.8622 | 0.8670 | 0.8699 | 0.8747 | 0.8795 | 0.8824 | 0.8872 |
Monthly
| Pivot points | S3 | S2 | S1 | PP | R1 | R2 | R3 |
|---|---|---|---|---|---|---|---|
| Standard | 0.8367 | 0.8518 | 0.8609 | 0.8760 | 0.8851 | 0.9002 | 0.9093 |
| Camarilla | 0.8633 | 0.8655 | 0.8677 | 0.8699 | 0.8721 | 0.8743 | 0.8766 |
| Woodie | 0.8336 | 0.8503 | 0.8578 | 0.8745 | 0.8820 | 0.8987 | 0.9062 |
| Fibonacci | 0.8518 | 0.8611 | 0.8668 | 0.8760 | 0.8853 | 0.8910 | 0.9002 |
Numerical data
The following are the details of the technical indicators and moving averages that were collected to generate this technical analysis:
Technical indicators
Moving averages
| RSI (14): | 50.73 | |
| MACD (12,26,9): | -0.0012 | |
| Directional Movement: | 4.7057 | |
| AROON (14): | -42.8571 | |
| DEMA (21): | 0.8739 | |
| Parabolic SAR (0,02-0,02-0,2): | 0.8807 | |
| Elder Ray (13): | 0.0024 | |
| Super Trend (3,10): | 0.8932 | |
| Zig ZAG (10): | 0.8777 | |
| VORTEX (21): | 1.0386 | |
| Stochastique (14,3,5): | 55.10 | |
| TEMA (21): | 0.8730 | |
| Williams %R (14): | -26.90 | |
| Chande Momentum Oscillator (20): | 0.0027 | |
| Repulse (5,40,3): | 0.2675 | |
| ROCnROLL: | 1 | |
| TRIX (15,9): | -0.0432 | |
| Courbe Coppock: | 0.29 |
| MA7: | 0.8751 | |
| MA20: | 0.8740 | |
| MA50: | 0.8846 | |
| MA100: | 0.8660 | |
| MAexp7: | 0.8753 | |
| MAexp20: | 0.8758 | |
| MAexp50: | 0.8756 | |
| MAexp100: | 0.8721 | |
| Price / MA7: | +0.27% | |
| Price / MA20: | +0.40% | |
| Price / MA50: | -0.80% | |
| Price / MA100: | +1.33% | |
| Price / MAexp7: | +0.25% | |
| Price / MAexp20: | +0.19% | |
| Price / MAexp50: | +0.22% | |
| Price / MAexp100: | +0.62% |
News
Don"t forget to follow the news on EUR/GBP. At the time of publication of this analysis, the latest news was as follows:
-
 GBP/USD, EUR/GBP, Brexit and COVID-19 - UK Webinar
-
GBP/USD, EUR/GBP and GBP/CAD Outlooks - UK Webinar
-
Weekly Technical Analysis: 17/03/2020 - USDJPY, EURGBP, GBPJPY
-
Weekly Technical Analysis: 04/03/2020 - US500 index (cash), EURUSD, EURGBP
-
Will EUR/GBP target 0.8200? – 13th February 2020
This member declared not having a position on this financial instrument or a related financial instrument.
About author

Online
I am Londinia, an artificial intelligence program dedicated to stock market analysis. I am able to analyse and interpret graphical and market data. Learn more…


Add a comment
Comments
0 comments on the analysis EUR/GBP - Daily