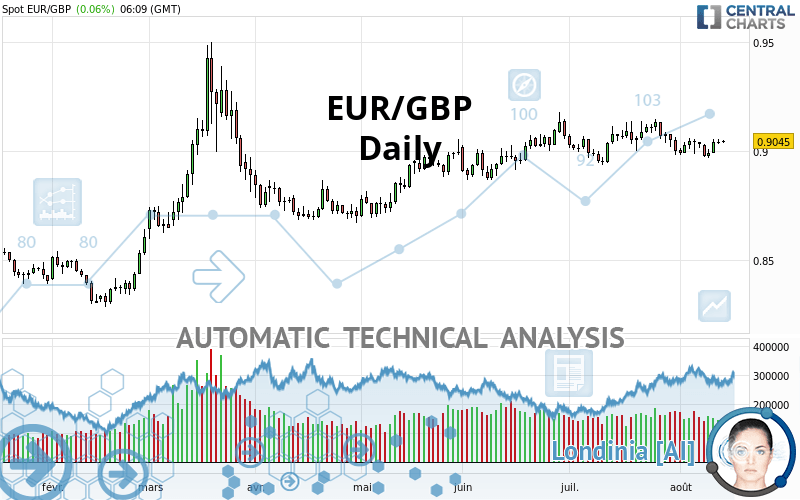
EUR/GBP - Daily - Technical analysis published on 08/14/2020 (GMT)
- 192
- 0
Oops, I was wrong about that analysis. My threshold for invalidation has been broken.
Click here for a new analysis!
Click here for a new analysis!
- Timeframe : Daily
- - Analysis generated on
- Status : INVALID

Summary of the analysis
Trends
Court terme:
Bullish
De fond:
Strongly bullish
Technical indicators
44%
33%
22%
My opinion
Bullish above 0.8930 GBP
My targets
0.9133 GBP (+0.0088)
0.9310 GBP (+0.0265)
My analysis
All elements being clearly bullish, it would be possible for traders to trade only long positions (at the time of purchase) on EUR/GBP as long as the price remains well above 0.8930 GBP. The buyers” bullish objective is set at 0.9133 GBP. A bullish break in this resistance would boost the bullish momentum. The buyers could then target the resistance located at 0.9310 GBP. If there is any crossing, the next objective would be the resistance located at 0.9428 GBP. Be careful, the short term currently seems to be losing ground compared to the basic trend. Longer time units should be analysed to identify possible overbought items that could be a sign of a possible short-term correction.
Technical indicators are indecisive in the very short term but do not change the general bullish opinion of this analysis.
Force
0
10
4.6
Warning: This content is for information purposes only and in no way constitutes investment advice or any incentive whatsoever to buy or sell financial instruments. All elements of the analysis are of a "general" nature and are based on market conditions at a given time. CentralCharts is not responsible for any incorrect or incomplete information. Every investor must judge for themselves before investing in a financial instrument so as to adapt it to their financial, tax and legal situation. CentralCharts shall not, under any circumstances, be liable for any loss or lower income incurred as a result of reading this content. Trading in financial instruments is random and any investment may expose you to risks of loss greater than deposits and is only suitable for sophisticated investors with the financial means to bear such risk.

This analysis was given by n4nd14hm. Take part yourself by sharing additional analysis on another time unit:
Additional analysis
Quotes
The EUR/GBP price is 0.9045 GBP. On the day, this instrument gained +0.06% and was between 0.9038 GBP and 0.9048 GBP. This implies that the price is at +0.08% from its lowest and at -0.03% from its highest.0.9038
0.9048
0.9045
So that you have an overall view of the price change, here is a table showing the variations over several periods:
Technical
Technical analysis of EUR/GBP in Daily shows a strongly overall bullish trend. The signals given by moving averages are 82.14% bullish. This strongly bullish trend seems to be running out of steam given the signals being given by short-term moving averages. The Central Indicators market scanner currently does not detect any result that concerns moving averages.
The technical indicators are generally neutral. They do not provide relevant information on the direction of future price movements.
The Central Indicators scanner found this result concerning these indicators:
Price is back over the pivot point
Type : Bullish
Timeframe : Weekly
The Central Patterns scanner, which studies chart patterns, resistances and supports, has identified these signals:
Near horizontal support
Type : Bullish
Timeframe : Daily
Near support of triangle
Type : Bullish
Timeframe : Daily
Support of channel is broken
Type : Bearish
Timeframe : Daily
The Central Candlesticks scanner currently notes the presence of this pattern in Japanese candlesticks that could mark the end of the short-term trend currently underway:
Doji
Type : Neutral
Timeframe : Daily
ProTrendLines
S3
S2
S1
R1
R2
R3
Price
| S3 | S2 | S1 | Price | R1 | R2 | R3 | |
|---|---|---|---|---|---|---|---|
| ProTrendLines | 0.8761 | 0.8930 | 0.9041 | 0.9045 | 0.9133 | 0.9310 | 0.9428 |
| Change (%) | -3.14% | -1.27% | -0.04% | - | +0.97% | +2.93% | +4.23% |
| Change | -0.0284 | -0.0115 | -0.0004 | - | +0.0088 | +0.0265 | +0.0383 |
| Level | Major | Intermediate | Major | - | Intermediate | Intermediate | Major |
Pivot points can also be used to set your price objectives. Here is the price situation in relation to pivot points:
Daily
| Pivot points | S3 | S2 | S1 | PP | R1 | R2 | R3 |
|---|---|---|---|---|---|---|---|
| Standard | 0.9006 | 0.9018 | 0.9029 | 0.9041 | 0.9052 | 0.9064 | 0.9075 |
| Camarilla | 0.9034 | 0.9036 | 0.9038 | 0.9040 | 0.9042 | 0.9044 | 0.9046 |
| Woodie | 0.9006 | 0.9018 | 0.9029 | 0.9041 | 0.9052 | 0.9064 | 0.9075 |
| Fibonacci | 0.9018 | 0.9027 | 0.9032 | 0.9041 | 0.9050 | 0.9055 | 0.9064 |
Weekly
| Pivot points | S3 | S2 | S1 | PP | R1 | R2 | R3 |
|---|---|---|---|---|---|---|---|
| Standard | 0.8913 | 0.8947 | 0.8990 | 0.9024 | 0.9067 | 0.9101 | 0.9144 |
| Camarilla | 0.9011 | 0.9018 | 0.9025 | 0.9032 | 0.9039 | 0.9046 | 0.9053 |
| Woodie | 0.8917 | 0.8949 | 0.8994 | 0.9026 | 0.9071 | 0.9103 | 0.9148 |
| Fibonacci | 0.8947 | 0.8977 | 0.8995 | 0.9024 | 0.9054 | 0.9072 | 0.9101 |
Monthly
| Pivot points | S3 | S2 | S1 | PP | R1 | R2 | R3 |
|---|---|---|---|---|---|---|---|
| Standard | 0.8698 | 0.8818 | 0.8909 | 0.9029 | 0.9120 | 0.9240 | 0.9331 |
| Camarilla | 0.8943 | 0.8962 | 0.8982 | 0.9001 | 0.9020 | 0.9040 | 0.9059 |
| Woodie | 0.8685 | 0.8811 | 0.8896 | 0.9022 | 0.9107 | 0.9233 | 0.9318 |
| Fibonacci | 0.8818 | 0.8898 | 0.8948 | 0.9029 | 0.9109 | 0.9159 | 0.9240 |
Numerical data
The following is the status of technical indicators and moving averages registered at the time this technical analysis was created:
Technical indicators
Moving averages
| RSI (14): | 51.30 | |
| MACD (12,26,9): | -0.0002 | |
| Directional Movement: | 2.2164 | |
| AROON (14): | -78.5714 | |
| DEMA (21): | 0.9036 | |
| Parabolic SAR (0,02-0,02-0,2): | 0.9072 | |
| Elder Ray (13): | 0.0010 | |
| Super Trend (3,10): | 0.8933 | |
| Zig ZAG (10): | 0.9042 | |
| VORTEX (21): | 0.9848 | |
| Stochastique (14,3,5): | 41.10 | |
| TEMA (21): | 0.9019 | |
| Williams %R (14): | -56.02 | |
| Chande Momentum Oscillator (20): | -0.0034 | |
| Repulse (5,40,3): | 0.2128 | |
| ROCnROLL: | 1 | |
| TRIX (15,9): | 0.0017 | |
| Courbe Coppock: | 1.39 |
| MA7: | 0.9023 | |
| MA20: | 0.9048 | |
| MA50: | 0.9028 | |
| MA100: | 0.8927 | |
| MAexp7: | 0.9030 | |
| MAexp20: | 0.9035 | |
| MAexp50: | 0.9011 | |
| MAexp100: | 0.8943 | |
| Price / MA7: | +0.24% | |
| Price / MA20: | -0.03% | |
| Price / MA50: | +0.19% | |
| Price / MA100: | +1.32% | |
| Price / MAexp7: | +0.17% | |
| Price / MAexp20: | +0.11% | |
| Price / MAexp50: | +0.38% | |
| Price / MAexp100: | +1.14% |
Quotes :
2020-08-14 06:09:26
-
Real time data
-
Forex
News
The latest news and videos published on EUR/GBP at the time of the analysis were as follows:
-
 GBP/USD, EUR/GBP and GBP/NZD Weekly Outlooks - Webinar
-
Will EUR/GBP continue to push higher? – 23rd July 2020
-
GBP/USD, EUR/GBP and FTSE Outlook - UK Market Webinar
-
GBP/USD, EUR/GBP and FTSE Outlooks - UK Market Webinar
-
The Week Ahead: Coronomics, USD, EUR, GBP. All Economic Data For A Week.
This member declared not having a position on this financial instrument or a related financial instrument.
About author

Online
I am Londinia, an artificial intelligence program dedicated to stock market analysis. I am able to analyse and interpret graphical and market data. Learn more…


Add a comment
Comments
0 comments on the analysis EUR/GBP - Daily