LLAMA GROUP - Daily - Technical analysis published on 07/22/2022 (GMT)
- 165
- 0
- Timeframe : Daily
- - Analysis generated on
- Status : NEUTRAL

Summary of the analysis

Additional analysis
Quotes
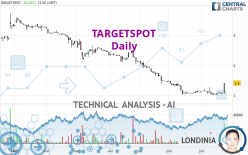
The TARGETSPOT rating is 1.400 EUR. The price has increased by +32.08% since the last closing with the lowest point at 1.060 EUR and the highest point at 1.400 EUR. The deviation from the price is +32.08% for the low point and 0% for the high point.A study of price movements over other periods shows the following variations:
New HIGH record (1 month)
Type : Bullish
Timeframe : Weekly
Technical
Technical analysis of this Daily chart of TARGETSPOT indicates that the overall trend is bearish. The signals given by the moving averages are at 64.29% bearish. This bearish trend could quickly slow down given the strong bullish signals currently being given by short-term moving averages. An assessment of moving averages reveals several bullish signals that could impact this trend:
Bullish price crossover with Moving Average 20
Type : Bullish
Timeframe : Daily
Bullish price crossover with Moving Average 50
Type : Bullish
Timeframe : Daily
Bullish price crossover with adaptative moving average 20
Type : Bullish
Timeframe : Daily
Bullish price crossover with adaptative moving average 50
Type : Bullish
Timeframe : Daily
Bullish price crossover with adaptative moving average 100
Type : Bullish
Timeframe : Daily
The technical indicators are bullish. There is still some doubt about the price increase.
But beware of excesses. The Central Indicators scanner currently detects this:
CCI indicator is overbought : over 100
Type : Neutral
Timeframe : Daily
Williams %R indicator is overbought : over -20
Type : Neutral
Timeframe : Daily
Pivot points : price is over resistance 3
Type : Neutral
Timeframe : Daily
Pivot points : price is over resistance 3
Type : Neutral
Timeframe : Weekly
RSI indicator is back over 50
Type : Bullish
Timeframe : Daily
Parabolic SAR indicator bullish reversal
Type : Bullish
Timeframe : Daily
Aroon indicator bullish trend
Type : Bullish
Timeframe : Daily
SuperTrend indicator bullish reversal
Type : Bullish
Timeframe : Daily
Momentum indicator is back over 0
Type : Bullish
Timeframe : Daily
Central Patterns, the scanner specializing in chart patterns, did not identify any signals.
The presence of these bullish Japanese candlestick patterns detected by Central Candlesticks that could cause a very short term rebound were also noted:
White marubozu
Type : Bullish
Timeframe : Daily
Long white line
Type : Bullish
Timeframe : Daily
| S1 | Price | R1 | R2 | R3 | |
|---|---|---|---|---|---|
| ProTrendLines | 1.050 | 1.400 | 2.240 | 2.580 | 2.885 |
| Change (%) | -25.00% | - | +60.00% | +84.29% | +106.07% |
| Change | -0.350 | - | +0.840 | +1.180 | +1.485 |
| Level | Major | - | Minor | Minor | Intermediate |
Pivot points can also be used to set your price objectives. Here is the price situation in relation to pivot points:
| Pivot points | S3 | S2 | S1 | PP | R1 | R2 | R3 |
|---|---|---|---|---|---|---|---|
| Standard | 1.043 | 1.047 | 1.053 | 1.057 | 1.063 | 1.067 | 1.073 |
| Camarilla | 1.057 | 1.058 | 1.059 | 1.060 | 1.061 | 1.062 | 1.063 |
| Woodie | 1.045 | 1.048 | 1.055 | 1.058 | 1.065 | 1.068 | 1.075 |
| Fibonacci | 1.047 | 1.051 | 1.053 | 1.057 | 1.061 | 1.063 | 1.067 |
| Pivot points | S3 | S2 | S1 | PP | R1 | R2 | R3 |
|---|---|---|---|---|---|---|---|
| Standard | 0.928 | 0.972 | 1.023 | 1.067 | 1.118 | 1.162 | 1.213 |
| Camarilla | 1.049 | 1.058 | 1.066 | 1.075 | 1.084 | 1.092 | 1.101 |
| Woodie | 0.933 | 0.974 | 1.028 | 1.069 | 1.123 | 1.164 | 1.218 |
| Fibonacci | 0.972 | 1.008 | 1.030 | 1.067 | 1.103 | 1.125 | 1.162 |
| Pivot points | S3 | S2 | S1 | PP | R1 | R2 | R3 |
|---|---|---|---|---|---|---|---|
| Standard | 0.437 | 0.718 | 0.917 | 1.198 | 1.397 | 1.678 | 1.877 |
| Camarilla | 0.983 | 1.027 | 1.071 | 1.115 | 1.159 | 1.203 | 1.247 |
| Woodie | 0.395 | 0.698 | 0.875 | 1.178 | 1.355 | 1.658 | 1.835 |
| Fibonacci | 0.718 | 0.902 | 1.015 | 1.198 | 1.382 | 1.495 | 1.678 |
Numerical data
The following are the details of the technical indicators and moving averages that were collected to generate this technical analysis:
| RSI (14): | 61.35 | |
| MACD (12,26,9): | -0.0410 | |
| Directional Movement: | 16.193 | |
| AROON (14): | 57.143 | |
| DEMA (21): | 1.043 | |
| Parabolic SAR (0,02-0,02-0,2): | 1.015 | |
| Elder Ray (13): | 0.065 | |
| Super Trend (3,10): | 0.976 | |
| Zig ZAG (10): | 1.280 | |
| VORTEX (21): | 0.9180 | |
| Stochastique (14,3,5): | 43.79 | |
| TEMA (21): | 1.121 | |
| Williams %R (14): | 0.00 | |
| Chande Momentum Oscillator (20): | 0.155 | |
| Repulse (5,40,3): | 22.4600 | |
| ROCnROLL: | -1 | |
| TRIX (15,9): | -0.8220 | |
| Courbe Coppock: | 2.84 |
| MA7: | 1.094 | |
| MA20: | 1.099 | |
| MA50: | 1.261 | |
| MA100: | 1.800 | |
| MAexp7: | 1.119 | |
| MAexp20: | 1.118 | |
| MAexp50: | 1.328 | |
| MAexp100: | 1.733 | |
| Price / MA7: | +27.97% | |
| Price / MA20: | +27.39% | |
| Price / MA50: | +11.02% | |
| Price / MA100: | -22.22% | |
| Price / MAexp7: | +25.11% | |
| Price / MAexp20: | +25.22% | |
| Price / MAexp50: | +5.42% | |
| Price / MAexp100: | -19.22% |
News
Don't forget to follow the news on TARGETSPOT. At the time of publication of this analysis, the latest news was as follows:
- Targetspot Signs Major Video Partnership With ShowHeroes
- Targetspot Expands to Latin America With Top-tier Partnerships
- AudioValley is Changing Its Name to Targetspot
- AudioValley: Excellent 2021 Annual Results for the Targetspot Division. And Strong Investment in the Winamp Division
- AudioValley launches Bridger, a new independent rights management entity for songwriters
About author
Online


Add a comment
Comments
0 comments on the analysis LLAMA GROUP - Daily