EUR/USD - Broke Below Its Trading Range - 01/03/2017 (GMT)
- Who voted?
- 609
- 0
- Timeframe : Daily
EUR/USD Chart
Are you looking for opportunities in indices and forex?
DISCOVER LONDINIA OPPORTUNITIES...
DISCOVER LONDINIA OPPORTUNITIES...
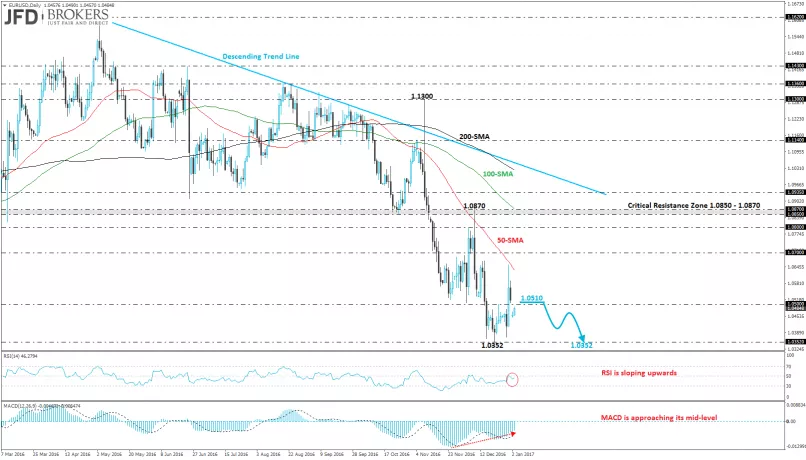
The EUR/USD pair plunged more than 3% over the last year and hit a fresh 13-year low at 1.0352 against the U.S. dollar whilst it recorded three consecutive negative months in December. The main focus this week will be the December’s non-farm payrolls report, the first one after Federal Reserve raised rates.
The world’s most traded currency penetrated to the downside the multi-month consolidation area in December, with upper boundary the 1.0620 resistance level and lower boundary the 1.0500 support barrier. The pair surged above 1.0600 in thin liquidity conditions last week while the new year starts with the investors still wondering if the currency pair will hit parity. If the U.S. dollar continues to strengthen then the euro will continue to weaken. Early this morning, the price opened with a gap to the downside and now is developing below the 1.0500 price level. The single currency may create an upward move for recovering the gap, however, a failed attempt of surpassing the latter level will move the price towards the 1.0352 support level. On the daily timeframe, technical indicators are still moving within the negative territory while the RSI indicator is sloping upwards. The MACD oscillator crossed its trigger line to the upside and is approaching its mid-level.
The world’s most traded currency penetrated to the downside the multi-month consolidation area in December, with upper boundary the 1.0620 resistance level and lower boundary the 1.0500 support barrier. The pair surged above 1.0600 in thin liquidity conditions last week while the new year starts with the investors still wondering if the currency pair will hit parity. If the U.S. dollar continues to strengthen then the euro will continue to weaken. Early this morning, the price opened with a gap to the downside and now is developing below the 1.0500 price level. The single currency may create an upward move for recovering the gap, however, a failed attempt of surpassing the latter level will move the price towards the 1.0352 support level. On the daily timeframe, technical indicators are still moving within the negative territory while the RSI indicator is sloping upwards. The MACD oscillator crossed its trigger line to the upside and is approaching its mid-level.
This member did not declare if he had a position on this financial instrument or a related financial instrument.
About author

Offline


Add a comment
Comments
0 comments on the analysis EUR/USD - Daily