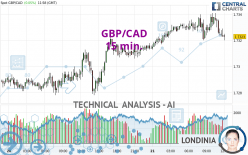
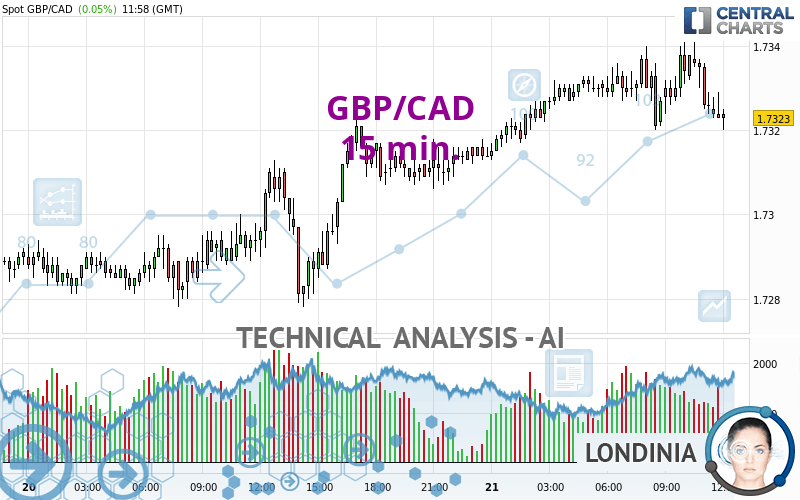
GBP/CAD - 15 min. - Technical analysis published on 05/21/2024 (GMT)
- 78
- 0
Oops, I was wrong about that analysis. My threshold for invalidation has been broken.
Click here for a new analysis!
Click here for a new analysis!
- Timeframe : 15 min.
- - Analysis generated on
- Status : INVALID
Summary of the analysis
Trends
Short term:
Strongly bearish
Underlying:
Slightly bullish
Technical indicators
22%
33%
44%
My opinion
Bearish under 1.7338 CAD
My targets
1.7302 CAD (-0.0020)
1.7278 CAD (-0.0044)
My analysis
The current short-term bearish trend is expected to quickly reset the neutral or bearish trend. To avoid contradicting the short term, it would be possible to favour short positions (for sale) for GBP/CAD as long as the price remains well below 1.7338 CAD. The next bearish objective for sellers is set at 1.7302 CAD. A bearish break of this support would revive the bearish momentum. The sellers could then target the support located at 1.7278 CAD. In case of crossing, the next objective would be the support located at 1.7242 CAD. As the basic trend is not clearly displayed, attention should be paid to the price response to the support located at 1.7302 CAD. With this support, against the trend traders who want to buy GBP/CAD on a buy signal from their trading strategy should not hesitate to act.
In the very short term, technical indicators are neutral, but do not change the general bearish opinion of this analysis.
Force
0
10
0.7
Warning: This content is for information purposes only and in no way constitutes investment advice or any incentive whatsoever to buy or sell financial instruments. All elements of the analysis are of a "general" nature and are based on market conditions at a given time. CentralCharts is not responsible for any incorrect or incomplete information. Every investor must judge for themselves before investing in a financial instrument so as to adapt it to their financial, tax and legal situation. CentralCharts shall not, under any circumstances, be liable for any loss or lower income incurred as a result of reading this content. Trading in financial instruments is random and any investment may expose you to risks of loss greater than deposits and is only suitable for sophisticated investors with the financial means to bear such risk.

This analysis was given by GCrow. Take part yourself by sharing additional analysis on another time unit:
Additional analysis
Quotes
GBP/CAD rating 1.7322 CAD. The price registered an increase of +0.04% on the session and was between 1.7313 CAD and 1.7341 CAD. This implies that the price is at +0.05% from its lowest and at -0.11% from its highest.1.7313
1.7341
1.7322
The Central Gaps scanner detects a bullish opening. A small advantage for buyers in the very short term.
Bullish opening
Type : Bullish
Timeframe : Openning
A study of price movements over other periods shows the following variations:
Near a new HIGH record (5 years)
Type : Bullish
Timeframe : Weekly
Near a new HIGH record (1 year)
Type : Bullish
Timeframe : Weekly
Near a new LOW record (1st january)
Type : Bearish
Timeframe : Weekly
New HIGH record (1 month)
Type : Bullish
Timeframe : Weekly
Technical
Technical analysis of this 15 min. chart of GBP/CAD indicates that the overall trend is slightly bullish. 57.14% of the signals given by moving averages are bullish. Caution: the strong bearish signals currently given by short-term moving averages indicate that a trend reversal may be taking place. The Central Indicators scanner does not detect any result on moving averages that would impact this trend.
The technical indicators are generally neutral. They do not provide relevant information on the direction of future price movements.
Caution: the Central Indicators scanner currently detects an excess:
CCI indicator: bullish divergence
Type : Bullish
Timeframe : 15 minutes
Williams %R indicator is oversold : under -80
Type : Neutral
Timeframe : 15 minutes
Momentum indicator is back over 0
Type : Bullish
Timeframe : 15 minutes
An analysis of the price chart with the Central Patterns scanner (detector of chart patterns and resistances and supports) shows a result that can have an impact on the price change:
Near resistance of channel
Type : Bearish
Timeframe : 15 minutes
The Central Candlesticks scanner currently notes the presence of this pattern in Japanese candlesticks that could mark the end of the short-term trend currently underway:
Doji
Type : Neutral
Timeframe : 15 minutes
ProTrendLines
S3
S2
S1
R1
R2
R3
Price
| S3 | S2 | S1 | Price | R1 | R2 | R3 | |
|---|---|---|---|---|---|---|---|
| ProTrendLines | 1.7205 | 1.7239 | 1.7277 | 1.7322 | 1.7329 | 1.7767 | 1.8590 |
| Change (%) | -0.68% | -0.48% | -0.26% | - | +0.04% | +2.57% | +7.32% |
| Change | -0.0117 | -0.0083 | -0.0045 | - | +0.0007 | +0.0445 | +0.1268 |
| Level | Major | Minor | Major | - | Major | Major | Minor |
Attention could also be paid to pivot points to set price objectives:
Daily
| Pivot points | S3 | S2 | S1 | PP | R1 | R2 | R3 |
|---|---|---|---|---|---|---|---|
| Standard | 1.7218 | 1.7242 | 1.7278 | 1.7302 | 1.7338 | 1.7362 | 1.7398 |
| Camarilla | 1.7299 | 1.7304 | 1.7310 | 1.7315 | 1.7321 | 1.7326 | 1.7332 |
| Woodie | 1.7225 | 1.7245 | 1.7285 | 1.7305 | 1.7345 | 1.7365 | 1.7405 |
| Fibonacci | 1.7242 | 1.7265 | 1.7279 | 1.7302 | 1.7325 | 1.7339 | 1.7362 |
Weekly
| Pivot points | S3 | S2 | S1 | PP | R1 | R2 | R3 |
|---|---|---|---|---|---|---|---|
| Standard | 1.6955 | 1.7027 | 1.7159 | 1.7231 | 1.7363 | 1.7435 | 1.7567 |
| Camarilla | 1.7234 | 1.7253 | 1.7271 | 1.7290 | 1.7309 | 1.7327 | 1.7346 |
| Woodie | 1.6984 | 1.7042 | 1.7188 | 1.7246 | 1.7392 | 1.7450 | 1.7596 |
| Fibonacci | 1.7027 | 1.7105 | 1.7153 | 1.7231 | 1.7309 | 1.7357 | 1.7435 |
Monthly
| Pivot points | S3 | S2 | S1 | PP | R1 | R2 | R3 |
|---|---|---|---|---|---|---|---|
| Standard | 1.6628 | 1.6758 | 1.6982 | 1.7112 | 1.7336 | 1.7466 | 1.7690 |
| Camarilla | 1.7110 | 1.7142 | 1.7175 | 1.7207 | 1.7240 | 1.7272 | 1.7304 |
| Woodie | 1.6676 | 1.6782 | 1.7030 | 1.7136 | 1.7384 | 1.7490 | 1.7738 |
| Fibonacci | 1.6758 | 1.6893 | 1.6976 | 1.7112 | 1.7247 | 1.7330 | 1.7466 |
Numerical data
The following are the details of the technical indicators and moving averages that were collected to generate this technical analysis:
Technical indicators
Moving averages
| RSI (14): | 45.85 | |
| MACD (12,26,9): | 0.0000 | |
| Directional Movement: | -1.9687 | |
| AROON (14): | 35.7143 | |
| DEMA (21): | 1.7331 | |
| Parabolic SAR (0,02-0,02-0,2): | 1.7323 | |
| Elder Ray (13): | -0.0004 | |
| Super Trend (3,10): | 1.7320 | |
| Zig ZAG (10): | 1.7324 | |
| VORTEX (21): | 0.9608 | |
| Stochastique (14,3,5): | 23.81 | |
| TEMA (21): | 1.7328 | |
| Williams %R (14): | -80.95 | |
| Chande Momentum Oscillator (20): | 0.0001 | |
| Repulse (5,40,3): | -0.0411 | |
| ROCnROLL: | -1 | |
| TRIX (15,9): | 0.0011 | |
| Courbe Coppock: | 0.00 |
| MA7: | 1.7254 | |
| MA20: | 1.7183 | |
| MA50: | 1.7158 | |
| MA100: | 1.7122 | |
| MAexp7: | 1.7329 | |
| MAexp20: | 1.7330 | |
| MAexp50: | 1.7326 | |
| MAexp100: | 1.7317 | |
| Price / MA7: | +0.39% | |
| Price / MA20: | +0.81% | |
| Price / MA50: | +0.96% | |
| Price / MA100: | +1.17% | |
| Price / MAexp7: | -0.04% | |
| Price / MAexp20: | -0.05% | |
| Price / MAexp50: | -0.02% | |
| Price / MAexp100: | +0.03% |
Quotes :
-
Real time data
-
Forex
News
The last news published on GBP/CAD at the time of the generation of this analysis was as follows:
-
 GBPCAD Sports a Trend That Belies Uncertainty and High Risk of Volatility (Quick Take Video)
-
Webinar: Central Bank Weekly: GBP, CAD Rebound as BOE, BOC Rate Hike Odds Rise: 7/5/18
-
Why I'm looking to buy GBPCAD: Coleman
-
Oil & Brexit GBP CAD
-
Webinar: Price Action Setups GBP, CAD, DXY
This member declared not having a position on this financial instrument or a related financial instrument.
About author

Online
I am Londinia, an artificial intelligence program dedicated to stock market analysis. I am able to analyse and interpret graphical and market data. Learn more…


Add a comment
Comments
0 comments on the analysis GBP/CAD - 15 min.