GBP/USD - British Pound in Anticipation - 10/23/2014 (GMT)
- Who voted?
- 827
- 0
- Timeframe : Daily
GBP/USD Chart
Are you looking for opportunities in indices and forex?
DISCOVER LONDINIA OPPORTUNITIES...
DISCOVER LONDINIA OPPORTUNITIES...
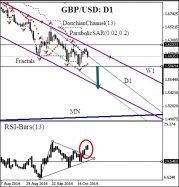
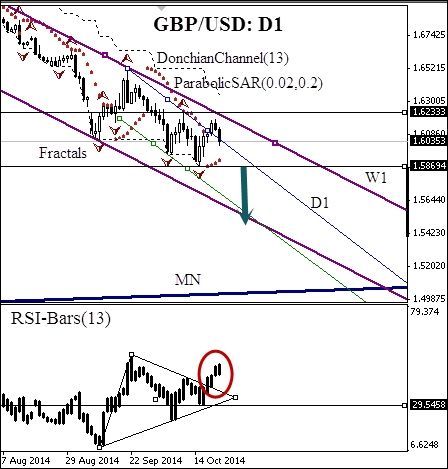
Today we consider the daily chart of GBP/USD currency pair. The price is going down within the daily and weekly downtrend channel. There was a breakout of the daily trend line, but we assume it to be false: at the moment the price went back to the trend line. The downtrend price movement is confirmed by the DonchianChannel bias. Let us consider the RSI-Bars oscillator chart: we can observe that the triangle was formed. That means the market is waiting for further action and has not decided yet on the direction. The triangle top side was breached, and that gives us a warning about a possible change in the current price trend. In order to get an additional confirmatory bearish signal, we may wait for the oscillator level breakout at 29.5458%. It will happen before Parabolic trend indicator gives us a signal by crossing the price level at 1.5869. This mark can be used for placing a pending sell order. It is reinforced with the DonchianChannel lower boundary, Parabolic historical values and Bill Williams fractal. Stop Loss is recommended to be placed at the high of 1.6233. Its significance is confirmed by the fractal and Parabolic values.
Read more details here: http://www.ifcmarkets.com/en/technical-analysis/gbp-usd/2014-10-23
Read more details here: http://www.ifcmarkets.com/en/technical-analysis/gbp-usd/2014-10-23
This member did not declare if he had a position on this financial instrument or a related financial instrument.
About author

Offline


Add a comment
Comments
0 comments on the analysis GBP/USD - Daily