GBP/USD - Slipped at 50-SMA - Target Locked! - 02/08/2017 (GMT)
- Who voted?
- 245
- 0
- Timeframe : 4H
GBP/USD Chart
Are you looking for opportunities in indices and forex?
DISCOVER LONDINIA OPPORTUNITIES...
DISCOVER LONDINIA OPPORTUNITIES...
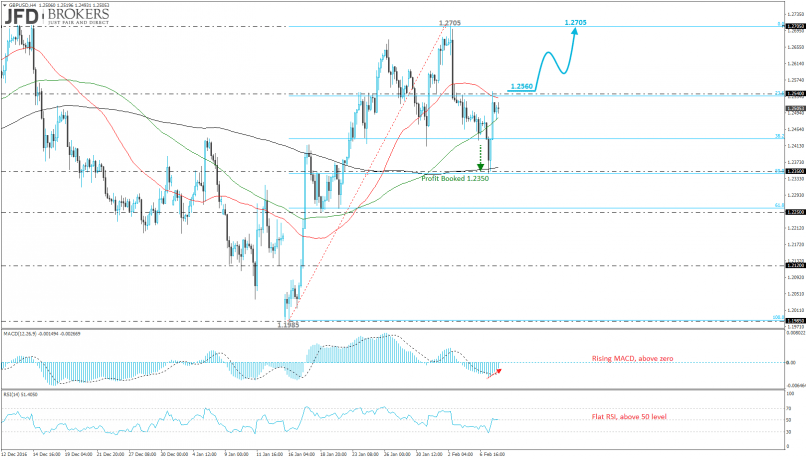
Sterling enjoyed a late rally against the U.S. dollar over yesterday’s session after it hit our suggested level at 1.2350 support barrier (see technical analysis here: http://bit.ly/2kkTsuJ) which is overlapping with the 50.0% Fibonacci retracement level of the last upward move (January 16th low until February 2nd high). At the end, the GBP/USD pair printed an almost neutral day as its open and close prices were not far away. Despite that, the price didn’t manage to surpass the 1.2540 resistance level and remained below it. Currently, the currency pair is developing within the 100 and 50 SMAs following the bounce off the 200-SMA on the 4-hour chart.
Additionally, if the price surpasses above the 1.2540 barrier, it would open the way for the 1.2705 strong obstacle. Technical indicators seem to be in agreement with the bullish thought as both are moving higher. MACD is rising in the oversold area whilst RSI jumped above the 50 level and is moving with weak momentum.
Additionally, if the price surpasses above the 1.2540 barrier, it would open the way for the 1.2705 strong obstacle. Technical indicators seem to be in agreement with the bullish thought as both are moving higher. MACD is rising in the oversold area whilst RSI jumped above the 50 level and is moving with weak momentum.
This member did not declare if he had a position on this financial instrument or a related financial instrument.
About author

Offline


Add a comment
Comments
0 comments on the analysis GBP/USD - 4H