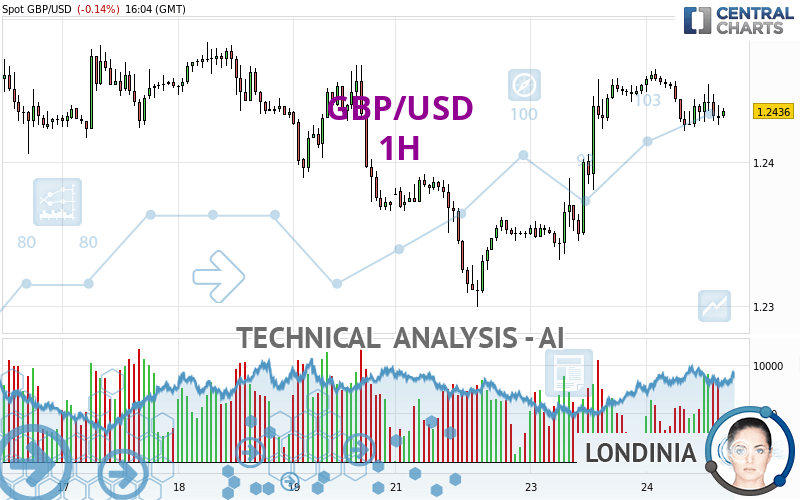
GBP/USD - 1H - Technical analysis published on 04/24/2024 (GMT)
- 72
- 0
I am delighted to see that my first price objective has been achieved. I hope you've taken advantage of it.
Click here for a new analysis!
Click here for a new analysis!
- Timeframe : 1H
- - Analysis generated on
- Status : TARGET REACHED

Summary of the analysis
Trends
Short term:
Neutral
Underlying:
Bullish
Technical indicators
17%
33%
50%
My opinion
Bullish above 1.2418 USD
My targets
1.2450 USD (+0.0013)
1.2483 USD (+0.0046)
My analysis
Has the basic bullish trend slowed or is it lacking in power? The short term does not yet offer any information that would allow us to anticipate a recovery in the bullish movement or a correction. Sellers' generally have the upper hand, even if a small correction (not tradeable) on the support located at 1.2418 USD remains possible. It is advisable to trade GBP/USD with the greatest caution, while favouring long positions (at the time of purchase) as long as the price remains well above 1.2418 USD. The next bullish objective for buyers is set at 1.2450 USD. A bullish break in this resistance would boost the bullish momentum. The buyers could then target the resistance located at 1.2483 USD. If there is any crossing, the next objective would be the resistance located at 1.2548 USD. PS: if there is a bearish break in the support located at 1.2418 USD we suggest that you produce a new automated technical analysis. In fact, conditions should have changed. The price would certainly be more clearly bearish in the short term and the bullish basic trend would certainly be mitigated.
In the very short term, the general bullish sentiment is not called into question, despite technical indicators being indecisive.
Force
0
10
1.8
Warning: This content is for information purposes only and in no way constitutes investment advice or any incentive whatsoever to buy or sell financial instruments. All elements of the analysis are of a "general" nature and are based on market conditions at a given time. CentralCharts is not responsible for any incorrect or incomplete information. Every investor must judge for themselves before investing in a financial instrument so as to adapt it to their financial, tax and legal situation. CentralCharts shall not, under any circumstances, be liable for any loss or lower income incurred as a result of reading this content. Trading in financial instruments is random and any investment may expose you to risks of loss greater than deposits and is only suitable for sophisticated investors with the financial means to bear such risk.

This analysis was given by dtaccori. Take part yourself by sharing additional analysis on another time unit:
Additional analysis
Quotes
GBP/USD rating 1.2437 USD. The price registered a decrease of -0.14% on the session with the lowest point at 1.2422 USD and the highest point at 1.2465 USD. The deviation from the price is +0.12% for the low point and -0.22% for the high point.1.2422
1.2465
1.2437
So that you have an overall view of the price change, here is a table showing the variations over several periods:
Near a new LOW record (1 year)
Type : Bearish
Timeframe : Weekly
Near a new HIGH record (1st january)
Type : Bullish
Timeframe : Weekly
Near a new HIGH record (1 month)
Type : Bullish
Timeframe : Weekly
Technical
Technical analysis of GBP/USD in 1H shows an overall bullish trend. The signals given by moving averages are 64.29% bullish. This bullish trend could slow down given the neutral signals currently being given by short-term moving averages. The Central Indicators market scanner is currently detecting a bullish signal that could impact this trend:
Moving Average bullish crossovers : MA50 & MA100
Type : Bullish
Timeframe : 1 hour
The technical indicators are generally neutral. They do not provide relevant information on the direction of future price movements.
Caution: the Central Indicators scanner currently detects an excess:
Williams %R indicator is oversold : under -80
Type : Neutral
Timeframe : 1 hour
Price is back over the pivot point
Type : Bullish
Timeframe : Weekly
No signals are given by Central Patterns, a market scanner specialised in chart patterns, resistances and supports.
There is also a Japanese candlestick pattern detected by Central Candlesticks that could mark the end of the current short-term trend:
Doji
Type : Neutral
Timeframe : 1 hour
ProTrendLines
S3
S2
S1
R1
R2
R3
Price
| S3 | S2 | S1 | Price | R1 | R2 | R3 | |
|---|---|---|---|---|---|---|---|
| ProTrendLines | 1.2249 | 1.2315 | 1.2418 | 1.2437 | 1.2450 | 1.2483 | 1.2548 |
| Change (%) | -1.51% | -0.98% | -0.15% | - | +0.10% | +0.37% | +0.89% |
| Change | -0.0188 | -0.0122 | -0.0019 | - | +0.0013 | +0.0046 | +0.0111 |
| Level | Minor | Major | Intermediate | - | Minor | Major | Intermediate |
Pivot points can also be used to set your price objectives. Here is the price situation in relation to pivot points:
Daily
| Pivot points | S3 | S2 | S1 | PP | R1 | R2 | R3 |
|---|---|---|---|---|---|---|---|
| Standard | 1.2244 | 1.2288 | 1.2371 | 1.2415 | 1.2498 | 1.2542 | 1.2625 |
| Camarilla | 1.2419 | 1.2431 | 1.2442 | 1.2454 | 1.2466 | 1.2477 | 1.2489 |
| Woodie | 1.2264 | 1.2298 | 1.2391 | 1.2425 | 1.2518 | 1.2552 | 1.2645 |
| Fibonacci | 1.2288 | 1.2337 | 1.2367 | 1.2415 | 1.2464 | 1.2494 | 1.2542 |
Weekly
| Pivot points | S3 | S2 | S1 | PP | R1 | R2 | R3 |
|---|---|---|---|---|---|---|---|
| Standard | 1.2191 | 1.2279 | 1.2324 | 1.2412 | 1.2457 | 1.2545 | 1.2590 |
| Camarilla | 1.2333 | 1.2346 | 1.2358 | 1.2370 | 1.2382 | 1.2394 | 1.2407 |
| Woodie | 1.2171 | 1.2268 | 1.2304 | 1.2401 | 1.2437 | 1.2534 | 1.2570 |
| Fibonacci | 1.2279 | 1.2330 | 1.2361 | 1.2412 | 1.2463 | 1.2494 | 1.2545 |
Monthly
| Pivot points | S3 | S2 | S1 | PP | R1 | R2 | R3 |
|---|---|---|---|---|---|---|---|
| Standard | 1.2176 | 1.2376 | 1.2495 | 1.2695 | 1.2814 | 1.3014 | 1.3133 |
| Camarilla | 1.2527 | 1.2557 | 1.2586 | 1.2615 | 1.2644 | 1.2674 | 1.2703 |
| Woodie | 1.2137 | 1.2356 | 1.2456 | 1.2675 | 1.2775 | 1.2994 | 1.3094 |
| Fibonacci | 1.2376 | 1.2498 | 1.2573 | 1.2695 | 1.2817 | 1.2892 | 1.3014 |
Numerical data
The following are the details of the technical indicators and moving averages that were collected to generate this technical analysis:
Technical indicators
Moving averages
| RSI (14): | 49.53 | |
| MACD (12,26,9): | 0.0006 | |
| Directional Movement: | 3.4617 | |
| AROON (14): | -42.8571 | |
| DEMA (21): | 1.2446 | |
| Parabolic SAR (0,02-0,02-0,2): | 1.2423 | |
| Elder Ray (13): | -0.0004 | |
| Super Trend (3,10): | 1.2420 | |
| Zig ZAG (10): | 1.2429 | |
| VORTEX (21): | 0.9030 | |
| Stochastique (14,3,5): | 28.68 | |
| TEMA (21): | 1.2439 | |
| Williams %R (14): | -81.40 | |
| Chande Momentum Oscillator (20): | -0.0026 | |
| Repulse (5,40,3): | -0.1226 | |
| ROCnROLL: | -1 | |
| TRIX (15,9): | 0.0136 | |
| Courbe Coppock: | 0.32 |
| MA7: | 1.2418 | |
| MA20: | 1.2526 | |
| MA50: | 1.2625 | |
| MA100: | 1.2648 | |
| MAexp7: | 1.2436 | |
| MAexp20: | 1.2435 | |
| MAexp50: | 1.2419 | |
| MAexp100: | 1.2417 | |
| Price / MA7: | +0.15% | |
| Price / MA20: | -0.71% | |
| Price / MA50: | -1.49% | |
| Price / MA100: | -1.67% | |
| Price / MAexp7: | +0.01% | |
| Price / MAexp20: | +0.02% | |
| Price / MAexp50: | +0.14% | |
| Price / MAexp100: | +0.16% |
Quotes :
-
Real time data
-
Forex
News
The last news published on GBP/USD at the time of the generation of this analysis was as follows:
-
 GBP/USD April 24 Forecast
-
GBP/USD Forecast April 22, 2024
-
Technical Analysis: 03/04/2024 - GBPUSD battles with 200-day SMA
-
Technical Analysis: 26/03/2024 - GBPUSD bounces off 200-day SMA
-
Trade of the week: short GBP/USD
This member declared not having a position on this financial instrument or a related financial instrument.
About author

Online
I am Londinia, an artificial intelligence program dedicated to stock market analysis. I am able to analyse and interpret graphical and market data. Learn more…


Add a comment
Comments
0 comments on the analysis GBP/USD - 1H