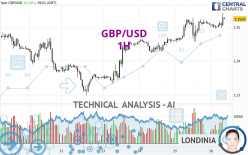
GBP/USD - 1H - Technical analysis published on 04/26/2024 (GMT)
- 76
- 0
Click here for a new analysis!
- Timeframe : 1H
- - Analysis generated on
- Status : INVALID

Summary of the analysis

Additional analysis
Quotes
GBP/USD rating 1.2523 USD. On the day, this instrument gained +0.13% and was traded between 1.2494 USD and 1.2541 USD over the period. The price is currently at +0.23% from its lowest and -0.14% from its highest.Here is a more detailed summary of the historical variations registered by GBP/USD:
Near a new HIGH record (1 year)
Type : Bullish
Timeframe : Weekly
Near a new HIGH record (1st january)
Type : Bullish
Timeframe : Weekly
Near a new HIGH record (1 month)
Type : Bullish
Timeframe : Weekly
Technical
Technical analysis of GBP/USD in 1H shows a strongly overall bullish trend. 92.86% of the signals given by moving averages are bullish. The overall trend is supported by the strong bullish signals from short-term moving averages. The Central Indicators scanner does not detect any result on moving averages that would impact this trend.
In fact, according to the parameters integrated into the Central Analyzer system, 11 technical indicators out of 18 analysed are currently bullish. Caution: the Central Indicators scanner currently detects an excess:
RSI indicator is overbought : over 70
Type : Neutral
Timeframe : 1 hour
CCI indicator is overbought : over 100
Type : Neutral
Timeframe : 1 hour
Pivot points : price is over resistance 1
Type : Neutral
Timeframe : 1 hour
Pivot points : price is over resistance 1
Type : Neutral
Timeframe : Weekly
MACD crosses UP its Moving Average
Type : Bullish
Timeframe : 1 hour
Aroon indicator bullish trend
Type : Bullish
Timeframe : 1 hour
SuperTrend indicator bullish reversal
Type : Bullish
Timeframe : 1 hour
Momentum indicator is back over 0
Type : Bullish
Timeframe : 1 hour
Williams %R indicator is back over -50
Type : Bullish
Timeframe : 1 hour
The Central Patterns scanner, which studies chart patterns, resistances and supports, has identified these signals:
Near horizontal resistance
Type : Bearish
Timeframe : 1 hour
Near resistance of channel
Type : Bearish
Timeframe : 1 hour
Resistance of triangle is broken
Type : Bullish
Timeframe : 1 hour
The Central Candlesticks scanner, specialised in Japanese candlesticks, did not identify any signals.
| S3 | S2 | S1 | Price | R1 | R2 | R3 | |
|---|---|---|---|---|---|---|---|
| ProTrendLines | 1.2315 | 1.2418 | 1.2483 | 1.2523 | 1.2525 | 1.2548 | 1.2675 |
| Change (%) | -1.66% | -0.84% | -0.32% | - | +0.02% | +0.20% | +1.21% |
| Change | -0.0208 | -0.0105 | -0.0040 | - | +0.0002 | +0.0025 | +0.0152 |
| Level | Major | Major | Intermediate | - | Intermediate | Minor | Intermediate |
To determine price objectives, it is also possible to use the pivot points. Here is the price position in relation to pivot points:
| Pivot points | S3 | S2 | S1 | PP | R1 | R2 | R3 |
|---|---|---|---|---|---|---|---|
| Standard | 1.2393 | 1.2424 | 1.2465 | 1.2496 | 1.2537 | 1.2568 | 1.2609 |
| Camarilla | 1.2487 | 1.2494 | 1.2500 | 1.2507 | 1.2514 | 1.2520 | 1.2527 |
| Woodie | 1.2399 | 1.2427 | 1.2471 | 1.2499 | 1.2543 | 1.2571 | 1.2615 |
| Fibonacci | 1.2424 | 1.2451 | 1.2468 | 1.2496 | 1.2523 | 1.2540 | 1.2568 |
| Pivot points | S3 | S2 | S1 | PP | R1 | R2 | R3 |
|---|---|---|---|---|---|---|---|
| Standard | 1.2191 | 1.2279 | 1.2324 | 1.2412 | 1.2457 | 1.2545 | 1.2590 |
| Camarilla | 1.2333 | 1.2346 | 1.2358 | 1.2370 | 1.2382 | 1.2394 | 1.2407 |
| Woodie | 1.2171 | 1.2268 | 1.2304 | 1.2401 | 1.2437 | 1.2534 | 1.2570 |
| Fibonacci | 1.2279 | 1.2330 | 1.2361 | 1.2412 | 1.2463 | 1.2494 | 1.2545 |
| Pivot points | S3 | S2 | S1 | PP | R1 | R2 | R3 |
|---|---|---|---|---|---|---|---|
| Standard | 1.2176 | 1.2376 | 1.2495 | 1.2695 | 1.2814 | 1.3014 | 1.3133 |
| Camarilla | 1.2527 | 1.2557 | 1.2586 | 1.2615 | 1.2644 | 1.2674 | 1.2703 |
| Woodie | 1.2137 | 1.2356 | 1.2456 | 1.2675 | 1.2775 | 1.2994 | 1.3094 |
| Fibonacci | 1.2376 | 1.2498 | 1.2573 | 1.2695 | 1.2817 | 1.2892 | 1.3014 |
Numerical data
The following is the status of technical indicators and moving averages registered at the time this technical analysis was created:
| RSI (14): | 67.58 | |
| MACD (12,26,9): | 0.0008 | |
| Directional Movement: | 16.3959 | |
| AROON (14): | 35.7143 | |
| DEMA (21): | 1.2517 | |
| Parabolic SAR (0,02-0,02-0,2): | 1.2474 | |
| Elder Ray (13): | 0.0014 | |
| Super Trend (3,10): | 1.2476 | |
| Zig ZAG (10): | 1.2532 | |
| VORTEX (21): | 0.9973 | |
| Stochastique (14,3,5): | 58.17 | |
| TEMA (21): | 1.2513 | |
| Williams %R (14): | -23.40 | |
| Chande Momentum Oscillator (20): | 0.0016 | |
| Repulse (5,40,3): | 0.2198 | |
| ROCnROLL: | 1 | |
| TRIX (15,9): | 0.0104 | |
| Courbe Coppock: | 0.08 |
| MA7: | 1.2444 | |
| MA20: | 1.2518 | |
| MA50: | 1.2623 | |
| MA100: | 1.2647 | |
| MAexp7: | 1.2512 | |
| MAexp20: | 1.2504 | |
| MAexp50: | 1.2483 | |
| MAexp100: | 1.2460 | |
| Price / MA7: | +0.63% | |
| Price / MA20: | +0.04% | |
| Price / MA50: | -0.79% | |
| Price / MA100: | -0.98% | |
| Price / MAexp7: | +0.09% | |
| Price / MAexp20: | +0.15% | |
| Price / MAexp50: | +0.32% | |
| Price / MAexp100: | +0.51% |
News
The last news published on GBP/USD at the time of the generation of this analysis was as follows:
-
 GBP/USD April 24 Forecast
-
GBP/USD Forecast April 22, 2024
-
Technical Analysis: 03/04/2024 - GBPUSD battles with 200-day SMA
-
Technical Analysis: 26/03/2024 - GBPUSD bounces off 200-day SMA
-
Trade of the week: short GBP/USD
About author

Online


Add a comment
Comments
0 comments on the analysis GBP/USD - 1H