GBP/USD - 1H - Technical analysis published on 05/14/2024 (GMT)
- 75
- 0
Click here for a new analysis!
- Timeframe : 1H
- - Analysis generated on
- Status : TARGET REACHED

Summary of the analysis

Additional analysis
Quotes
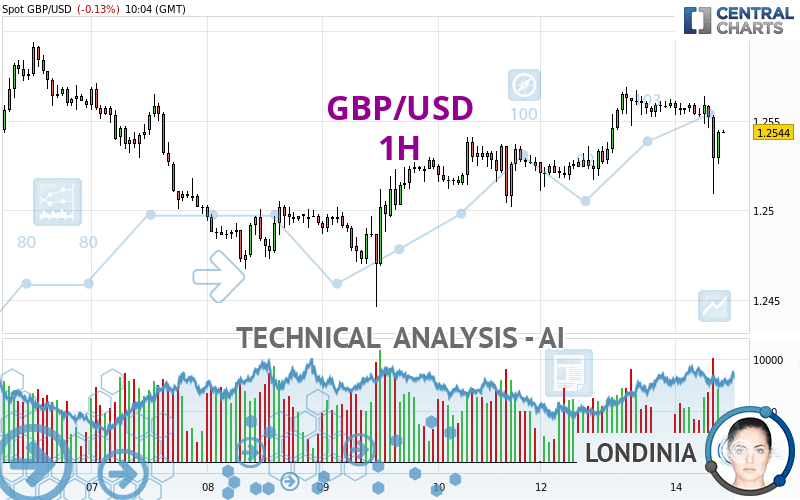
The GBP/USD rating is 1.2544 USD. The price is lower by -0.13% since the last closing with the lowest point at 1.2509 USD and the highest point at 1.2564 USD. The deviation from the price is +0.28% for the low point and -0.16% for the high point.So that you have an overall view of the price change, here is a table showing the variations over several periods:
Near a new HIGH record (1 year)
Type : Bullish
Timeframe : Weekly
Near a new HIGH record (1st january)
Type : Bullish
Timeframe : Weekly
Near a new LOW record (1 month)
Type : Bearish
Timeframe : Weekly
Technical
A technical analysis in 1H of this GBP/USD chart shows a bullish trend. 64.29% of the signals given by moving averages are bullish. Caution: the neutral signals currently given by short-term moving averages show us that the global trend is losing momentum. An assessment of moving averages reveals several bullish signals that could impact this trend:
Bullish price crossover with Moving Average 50
Type : Bullish
Timeframe : 1 hour
Bullish price crossover with adaptative moving average 50
Type : Bullish
Timeframe : 1 hour
Bullish price crossover with adaptative moving average 100
Type : Bullish
Timeframe : 1 hour
In fact, according to the parameters integrated into the Central Analyzer system, only 9 technical indicators out of 18 analysed are currently bearish. Caution: the Central Indicators scanner currently detects an excess:
CCI indicator is oversold : under -100
Type : Neutral
Timeframe : 1 hour
Previous candle closed under Bollinger bands
Type : Neutral
Timeframe : 1 hour
Williams %R indicator is back over -50
Type : Bullish
Timeframe : 1 hour
The Central Patterns scanner, which studies chart patterns, resistances and supports, has identified these signals:
Near support of triangle
Type : Bullish
Timeframe : 1 hour
Horizontal support is broken
Type : Bearish
Timeframe : 1 hour
Support of channel is broken
Type : Bearish
Timeframe : 1 hour
The Central Candlesticks scanner which studies Japanese candlesticks did not detect anything.
| S3 | S2 | S1 | Price | R1 | R2 | R3 | |
|---|---|---|---|---|---|---|---|
| ProTrendLines | 1.2490 | 1.2517 | 1.2540 | 1.2544 | 1.2556 | 1.2594 | 1.2633 |
| Change (%) | -0.43% | -0.22% | -0.03% | - | +0.10% | +0.40% | +0.71% |
| Change | -0.0054 | -0.0027 | -0.0004 | - | +0.0012 | +0.0050 | +0.0089 |
| Level | Minor | Intermediate | Intermediate | - | Major | Minor | Intermediate |
Pivot points can also be used to set your price objectives. Here is the price situation in relation to pivot points:
| Pivot points | S3 | S2 | S1 | PP | R1 | R2 | R3 |
|---|---|---|---|---|---|---|---|
| Standard | 1.2466 | 1.2489 | 1.2524 | 1.2547 | 1.2582 | 1.2605 | 1.2640 |
| Camarilla | 1.2544 | 1.2549 | 1.2555 | 1.2560 | 1.2565 | 1.2571 | 1.2576 |
| Woodie | 1.2473 | 1.2492 | 1.2531 | 1.2550 | 1.2589 | 1.2608 | 1.2647 |
| Fibonacci | 1.2489 | 1.2511 | 1.2525 | 1.2547 | 1.2569 | 1.2583 | 1.2605 |
| Pivot points | S3 | S2 | S1 | PP | R1 | R2 | R3 |
|---|---|---|---|---|---|---|---|
| Standard | 1.2301 | 1.2374 | 1.2449 | 1.2522 | 1.2597 | 1.2670 | 1.2745 |
| Camarilla | 1.2484 | 1.2498 | 1.2511 | 1.2525 | 1.2539 | 1.2552 | 1.2566 |
| Woodie | 1.2303 | 1.2375 | 1.2451 | 1.2523 | 1.2599 | 1.2671 | 1.2747 |
| Fibonacci | 1.2374 | 1.2430 | 1.2465 | 1.2522 | 1.2578 | 1.2613 | 1.2670 |
| Pivot points | S3 | S2 | S1 | PP | R1 | R2 | R3 |
|---|---|---|---|---|---|---|---|
| Standard | 1.1879 | 1.2089 | 1.2289 | 1.2499 | 1.2699 | 1.2909 | 1.3109 |
| Camarilla | 1.2376 | 1.2414 | 1.2451 | 1.2489 | 1.2527 | 1.2564 | 1.2602 |
| Woodie | 1.1874 | 1.2087 | 1.2284 | 1.2497 | 1.2694 | 1.2907 | 1.3104 |
| Fibonacci | 1.2089 | 1.2246 | 1.2342 | 1.2499 | 1.2656 | 1.2752 | 1.2909 |
Numerical data
The following is the status of technical indicators and moving averages registered at the time this technical analysis was created:
| RSI (14): | 43.59 | |
| MACD (12,26,9): | 0.0001 | |
| Directional Movement: | -16.1634 | |
| AROON (14): | -14.2857 | |
| DEMA (21): | 1.2553 | |
| Parabolic SAR (0,02-0,02-0,2): | 1.2559 | |
| Elder Ray (13): | -0.0017 | |
| Super Trend (3,10): | 1.2568 | |
| Zig ZAG (10): | 1.2540 | |
| VORTEX (21): | 0.9140 | |
| Stochastique (14,3,5): | 42.63 | |
| TEMA (21): | 1.2549 | |
| Williams %R (14): | -41.82 | |
| Chande Momentum Oscillator (20): | -0.0018 | |
| Repulse (5,40,3): | 0.0353 | |
| ROCnROLL: | -1 | |
| TRIX (15,9): | 0.0061 | |
| Courbe Coppock: | 0.16 |
| MA7: | 1.2529 | |
| MA20: | 1.2495 | |
| MA50: | 1.2592 | |
| MA100: | 1.2633 | |
| MAexp7: | 1.2547 | |
| MAexp20: | 1.2550 | |
| MAexp50: | 1.2541 | |
| MAexp100: | 1.2533 | |
| Price / MA7: | +0.12% | |
| Price / MA20: | +0.39% | |
| Price / MA50: | -0.38% | |
| Price / MA100: | -0.70% | |
| Price / MAexp7: | -0.02% | |
| Price / MAexp20: | -0.05% | |
| Price / MAexp50: | +0.02% | |
| Price / MAexp100: | +0.09% |
News
The last news published on GBP/USD at the time of the generation of this analysis was as follows:
-
 Weekly Technical Outlook: 08/05/2024 - USDJPY, GBPUSD, USDCAD
-
GBP/USD Forecast May 3, 2024
-
GBP/USD Forecast May 2, 2024
-
GBP/USD April 24 Forecast
-
GBP/USD Forecast April 22, 2024
About author

Online


Add a comment
Comments
0 comments on the analysis GBP/USD - 1H