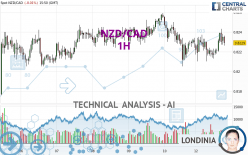
NZD/CAD - 1H - Technical analysis published on 05/13/2024 (GMT)
- 76
- 0
- Timeframe : 1H
- - Analysis generated on
- Status : NEUTRAL

Summary of the analysis

Additional analysis
Quotes
NZD/CAD rating 0.8229 CAD. The price is lower by -0.01% since the last closing with the lowest point at 0.8210 CAD and the highest point at 0.8243 CAD. The deviation from the price is +0.23% for the low point and -0.17% for the high point.A bearish opening was detected by the Central Gaps scanner. Sellers are trying to impose a bearish trend in the very short term.
Bearish opening
Type : Bearish
Timeframe : Openning
A study of price movements over other periods shows the following variations:
Near a new LOW record (1 year)
Type : Bearish
Timeframe : Weekly
Near a new HIGH record (1st january)
Type : Bullish
Timeframe : Weekly
Near a new LOW record (1 month)
Type : Bearish
Timeframe : Weekly
Technical
Technical analysis of this 1H chart of NZD/CAD indicates that the overall trend is slightly bullish. 53.57% of the signals given by moving averages are bullish. As the signals currently given by short-term moving averages are rather neutral, the overall trend could quickly return to neutral as well. The Central Indicators market scanner is currently detecting several bearish signals that could impact this trend:
Bearish price crossover with Moving Average 50
Type : Bearish
Timeframe : 1 hour
Bearish price crossover with Moving Average 100
Type : Bearish
Timeframe : 1 hour
Bearish price crossover with adaptative moving average 20
Type : Bearish
Timeframe : 1 hour
Bearish price crossover with adaptative moving average 50
Type : Bearish
Timeframe : 1 hour
Bearish price crossover with adaptative moving average 100
Type : Bearish
Timeframe : 1 hour
An assessment of technical indicators shows a moderate bullish signal.
Central Indicators, the detector scanner for these technical indicators recently detected a signal:
Ichimoku : price is under the cloud
Type : Bearish
Timeframe : 1 hour
Central Patterns, the market scanner focusing on chart patterns, resistances and supports found this result:
Near support of channel
Type : Bullish
Timeframe : 1 hour
No result was found by the Central Candlesticks scanner on Japanese candlesticks.
| S3 | S2 | S1 | Price | R1 | R2 | R3 | |
|---|---|---|---|---|---|---|---|
| ProTrendLines | 0.8119 | 0.8151 | 0.8206 | 0.8229 | 0.8245 | 0.8259 | 0.8311 |
| Change (%) | -1.34% | -0.95% | -0.28% | - | +0.19% | +0.36% | +1.00% |
| Change | -0.0110 | -0.0078 | -0.0023 | - | +0.0016 | +0.0030 | +0.0082 |
| Level | Minor | Minor | Major | - | Intermediate | Intermediate | Minor |
Pivot points can also be used to set your price objectives. Here is the price situation in relation to pivot points:
| Pivot points | S3 | S2 | S1 | PP | R1 | R2 | R3 |
|---|---|---|---|---|---|---|---|
| Standard | 0.8154 | 0.8179 | 0.8205 | 0.8230 | 0.8256 | 0.8281 | 0.8307 |
| Camarilla | 0.8216 | 0.8221 | 0.8225 | 0.8230 | 0.8235 | 0.8239 | 0.8244 |
| Woodie | 0.8154 | 0.8179 | 0.8205 | 0.8230 | 0.8256 | 0.8281 | 0.8307 |
| Fibonacci | 0.8179 | 0.8199 | 0.8211 | 0.8230 | 0.8250 | 0.8262 | 0.8281 |
| Pivot points | S3 | S2 | S1 | PP | R1 | R2 | R3 |
|---|---|---|---|---|---|---|---|
| Standard | 0.8150 | 0.8177 | 0.8204 | 0.8231 | 0.8258 | 0.8285 | 0.8312 |
| Camarilla | 0.8215 | 0.8220 | 0.8225 | 0.8230 | 0.8235 | 0.8240 | 0.8245 |
| Woodie | 0.8149 | 0.8177 | 0.8203 | 0.8231 | 0.8257 | 0.8285 | 0.8311 |
| Fibonacci | 0.8177 | 0.8198 | 0.8211 | 0.8231 | 0.8252 | 0.8265 | 0.8285 |
| Pivot points | S3 | S2 | S1 | PP | R1 | R2 | R3 |
|---|---|---|---|---|---|---|---|
| Standard | 0.7841 | 0.7953 | 0.8025 | 0.8137 | 0.8209 | 0.8321 | 0.8393 |
| Camarilla | 0.8046 | 0.8063 | 0.8080 | 0.8097 | 0.8114 | 0.8131 | 0.8148 |
| Woodie | 0.7821 | 0.7943 | 0.8005 | 0.8127 | 0.8189 | 0.8311 | 0.8373 |
| Fibonacci | 0.7953 | 0.8023 | 0.8067 | 0.8137 | 0.8207 | 0.8251 | 0.8321 |
Numerical data
The following is the status of technical indicators and moving averages registered at the time this technical analysis was created:
| RSI (14): | 51.60 | |
| MACD (12,26,9): | 0.0000 | |
| Directional Movement: | 0.5889 | |
| AROON (14): | 71.4286 | |
| DEMA (21): | 0.8227 | |
| Parabolic SAR (0,02-0,02-0,2): | 0.8215 | |
| Elder Ray (13): | 0.0003 | |
| Super Trend (3,10): | 0.8249 | |
| Zig ZAG (10): | 0.8230 | |
| VORTEX (21): | 0.9784 | |
| Stochastique (14,3,5): | 66.67 | |
| TEMA (21): | 0.8229 | |
| Williams %R (14): | -36.36 | |
| Chande Momentum Oscillator (20): | 0.0008 | |
| Repulse (5,40,3): | -0.0236 | |
| ROCnROLL: | 1 | |
| TRIX (15,9): | -0.0033 | |
| Courbe Coppock: | 0.08 |
| MA7: | 0.8233 | |
| MA20: | 0.8165 | |
| MA50: | 0.8186 | |
| MA100: | 0.8235 | |
| MAexp7: | 0.8230 | |
| MAexp20: | 0.8228 | |
| MAexp50: | 0.8230 | |
| MAexp100: | 0.8227 | |
| Price / MA7: | -0.05% | |
| Price / MA20: | +0.78% | |
| Price / MA50: | +0.53% | |
| Price / MA100: | -0.07% | |
| Price / MAexp7: | -0.01% | |
| Price / MAexp20: | +0.01% | |
| Price / MAexp50: | -0.01% | |
| Price / MAexp100: | +0.02% |
News
The last news published on NZD/CAD at the time of the generation of this analysis was as follows:
-
 Trading into 2024: Rules of Alternation in Elliot Wave using NZD/CAD
-
New Zealand Dollar Soars on RBNZ: NZD/USD, NZD/JPY, NZD/CAD Analysis
-
Quick Takes Video: Volatility vs Inevitability for USD/CAD, NZD/JPY, NZD/CAD
-
NZD/CAD To Potentially Reach Parity
About author
Online


Add a comment
Comments
0 comments on the analysis NZD/CAD - 1H