S&P 400 - Daily - Technical analysis published on 06/20/2019 (GMT)
- Who voted?
- 189
- 0
Click here for a new analysis!
- Timeframe : Daily
- - Analysis generated on
- Status : INVALID
Summary of the analysis

Additional analysis
Quotes
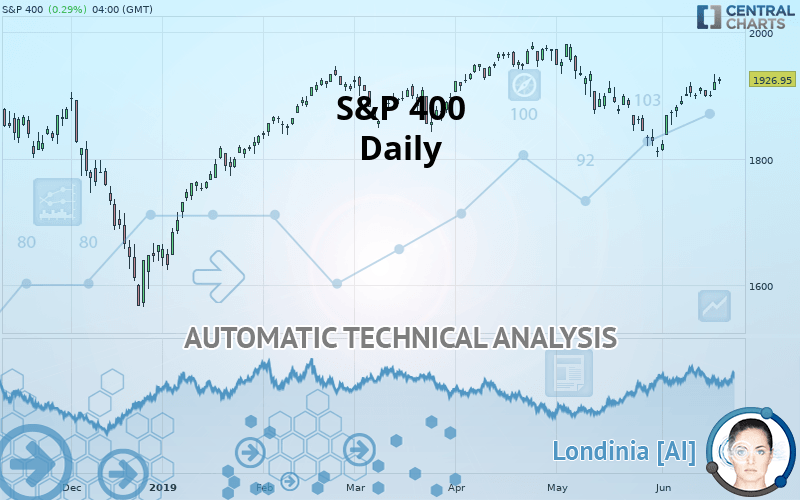
S&P 400 rating 1,926.95 USD. The price registered an increase of +0.29% on the session with the lowest point at 1,918.66 USD and the highest point at 1,928.75 USD. The deviation from the price is +0.43% for the low point and -0.09% for the high point.A study of price movements over other periods shows the following variations:
Near a new HIGH record (1st january)
Type : Bullish
Timeframe : Weekly
Near a new HIGH record (1 month)
Type : Bullish
Timeframe : Weekly
Technical
Technical analysis of S&P 400 in Daily shows an overall bullish trend. 75% of the signals given by moving averages are bullish. The overall trend is reinforced by the strong bullish signals from short-term moving averages. The Central Indicators scanner detects bullish signals on moving averages that could impact this trend:
Bullish price crossover with Moving Average 50
Type : Bullish
Timeframe : Daily
Bullish price crossover with Moving Average 100
Type : Bullish
Timeframe : Daily
Bullish price crossover with adaptative moving average 50
Type : Bullish
Timeframe : Daily
Technical indicators are strongly bullish, suggesting that the price increase should continue.
Caution: the Central Indicators scanner currently detects an excess:
CCI indicator is overbought : over 100
Type : Neutral
Timeframe : Daily
Williams %R indicator is overbought : over -20
Type : Neutral
Timeframe : Daily
Pivot points : price is over resistance 1
Type : Neutral
Timeframe : Weekly
MACD indicator is back over 0
Type : Bullish
Timeframe : Daily
Price is back over the pivot point
Type : Bullish
Timeframe : Daily
Central Patterns, the scanner specializing in chart patterns, did not identify any signals.
The Central Candlesticks scanner, specialised in Japanese candlesticks, did not identify any signals.
| S3 | S2 | S1 | Price | R1 | R2 | |
|---|---|---|---|---|---|---|
| ProTrendLines | 1,686.36 | 1,854.99 | 1,910.18 | 1,926.95 | 1,980.20 | 2,050.23 |
| Change (%) | -12.49% | -3.73% | -0.87% | - | +2.76% | +6.40% |
| Change | -240.59 | -71.96 | -16.77 | - | +53.25 | +123.28 |
| Level | Intermediate | Intermediate | Major | - | Intermediate | Major |
Attention could also be paid to pivot points to set price objectives:
| Pivot points | S3 | S2 | S1 | PP | R1 | R2 | R3 |
|---|---|---|---|---|---|---|---|
| Standard | 1,883.65 | 1,896.10 | 1,908.72 | 1,921.17 | 1,933.79 | 1,946.24 | 1,958.86 |
| Camarilla | 1,914.46 | 1,916.75 | 1,919.05 | 1,921.35 | 1,923.65 | 1,925.95 | 1,928.24 |
| Woodie | 1,883.74 | 1,896.14 | 1,908.81 | 1,921.21 | 1,933.89 | 1,946.28 | 1,958.95 |
| Fibonacci | 1,896.10 | 1,905.67 | 1,911.59 | 1,921.17 | 1,930.74 | 1,936.66 | 1,946.24 |
| Pivot points | S3 | S2 | S1 | PP | R1 | R2 | R3 |
|---|---|---|---|---|---|---|---|
| Standard | 1,861.58 | 1,878.00 | 1,888.96 | 1,905.38 | 1,916.34 | 1,932.76 | 1,943.72 |
| Camarilla | 1,892.39 | 1,894.90 | 1,897.41 | 1,899.92 | 1,902.43 | 1,904.94 | 1,907.45 |
| Woodie | 1,858.85 | 1,876.64 | 1,886.23 | 1,904.02 | 1,913.61 | 1,931.40 | 1,940.99 |
| Fibonacci | 1,878.00 | 1,888.46 | 1,894.92 | 1,905.38 | 1,915.84 | 1,922.30 | 1,932.76 |
Numerical data
The following is the status of the technical indicators and moving averages at the time of publication of this technical analysis:
| RSI (14): | 59.79 | |
| MACD (12,26,9): | 4.3200 | |
| Directional Movement: | 13.77 | |
| AROON (14): | 85.72 | |
| DEMA (21): | 1,895.68 | |
| Parabolic SAR (0,02-0,02-0,2): | 1,880.96 | |
| Elder Ray (13): | 25.11 | |
| Super Trend (3,10): | 1,861.98 | |
| Zig ZAG (10): | 1,926.95 | |
| VORTEX (21): | 1.0000 | |
| Stochastique (14,3,5): | 88.97 | |
| TEMA (21): | 1,908.39 | |
| Williams %R (14): | -5.08 | |
| Chande Momentum Oscillator (20): | 104.01 | |
| Repulse (5,40,3): | 0.4800 | |
| ROCnROLL: | 1 | |
| TRIX (15,9): | -0.0500 | |
| Courbe Coppock: | 6.67 |
| MA7: | 1,909.40 | |
| MA20: | 1,876.28 | |
| MA50: | 1,914.99 | |
| MA100: | 1,902.58 | |
| MAexp7: | 1,908.79 | |
| MAexp20: | 1,895.08 | |
| MAexp50: | 1,898.26 | |
| MAexp100: | 1,893.58 | |
| Price / MA7: | +0.92% | |
| Price / MA20: | +2.70% | |
| Price / MA50: | +0.62% | |
| Price / MA100: | +1.28% | |
| Price / MAexp7: | +0.95% | |
| Price / MAexp20: | +1.68% | |
| Price / MAexp50: | +1.51% | |
| Price / MAexp100: | +1.76% |
About author

Online


Add a comment
Comments
0 comments on the analysis S&P 400 - Daily