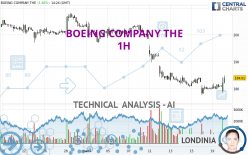
BOEING COMPANY THE - 1H - Technical analysis published on 03/20/2024 (GMT)
- 93
- 0
Click here for a new analysis!
- Timeframe : 1H
- - Analysis generated on
- Status : LEVEL MAINTAINED

Summary of the analysis

Additional analysis
Quotes
BOEING COMPANY THE rating 184.59 USD. The price registered an increase of +1.91% on the session with the lowest point at 178.60 USD and the highest point at 184.95 USD. The deviation from the price is +3.35% for the low point and -0.19% for the high point.The Central Gaps scanner detects a bearish gap which is a sign that the sellers have taken the lead in the very short term.
Opening Gap DOWN
Type : Bearish
Timeframe : Openning
A study of price movements over other periods shows the following variations:
Near a new LOW record (1 year)
Type : Bearish
Timeframe : Weekly
Near a new LOW record (1st january)
Type : Bearish
Timeframe : Weekly
Near a new LOW record (1 month)
Type : Bearish
Timeframe : Weekly
Technical
A technical analysis in 1H of this BOEING COMPANY THE chart shows a bearish trend. 71.43% of the signals given by moving averages are bearish. Caution: the slightly bullish signals currently given by short-term moving averages show a possible weakening of the global trend. The Central Indicators market scanner is currently detecting several bullish signals that could impact this trend:
Bullish trend reversal : adaptative moving average 20
Type : Bullish
Timeframe : 1 hour
Bullish price crossover with Moving Average 50
Type : Bullish
Timeframe : 1 hour
In fact, according to the parameters integrated into the Central Analyzer system, 13 technical indicators out of 18 analysed are currently bullish. Caution: the Central Indicators scanner currently detects an excess:
CCI indicator is overbought : over 100
Type : Neutral
Timeframe : 1 hour
Williams %R indicator is overbought : over -20
Type : Neutral
Timeframe : 1 hour
Pivot points : price is over resistance 3
Type : Neutral
Timeframe : 1 hour
Central Patterns, the market scanner focusing on chart patterns, resistances and supports found these results:
Near horizontal support
Type : Bullish
Timeframe : 1 hour
Near support of triangle
Type : Bullish
Timeframe : 1 hour
No result was found by the Central Candlesticks scanner on Japanese candlesticks.
| S3 | S2 | S1 | Price | R1 | R2 | R3 | |
|---|---|---|---|---|---|---|---|
| ProTrendLines | 177.73 | 180.52 | 184.18 | 184.59 | 195.07 | 203.90 | 208.02 |
| Change (%) | -3.72% | -2.20% | -0.22% | - | +5.68% | +10.46% | +12.69% |
| Change | -6.86 | -4.07 | -0.41 | - | +10.48 | +19.31 | +23.43 |
| Level | Major | Minor | Minor | - | Major | Intermediate | Intermediate |
To determine price objectives, it is also possible to use the pivot points. Here is the price position in relation to pivot points:
| Pivot points | S3 | S2 | S1 | PP | R1 | R2 | R3 |
|---|---|---|---|---|---|---|---|
| Standard | 177.85 | 178.79 | 179.97 | 180.91 | 182.09 | 183.03 | 184.21 |
| Camarilla | 180.56 | 180.75 | 180.95 | 181.14 | 181.33 | 181.53 | 181.72 |
| Woodie | 177.96 | 178.85 | 180.08 | 180.97 | 182.20 | 183.09 | 184.32 |
| Fibonacci | 178.79 | 179.60 | 180.10 | 180.91 | 181.72 | 182.22 | 183.03 |
| Pivot points | S3 | S2 | S1 | PP | R1 | R2 | R3 |
|---|---|---|---|---|---|---|---|
| Standard | 161.13 | 170.82 | 176.68 | 186.37 | 192.23 | 201.92 | 207.78 |
| Camarilla | 178.25 | 179.68 | 181.11 | 182.53 | 183.96 | 185.38 | 186.81 |
| Woodie | 159.21 | 169.86 | 174.76 | 185.41 | 190.31 | 200.96 | 205.86 |
| Fibonacci | 170.82 | 176.76 | 180.43 | 186.37 | 192.31 | 195.98 | 201.92 |
| Pivot points | S3 | S2 | S1 | PP | R1 | R2 | R3 |
|---|---|---|---|---|---|---|---|
| Standard | 178.22 | 187.69 | 195.70 | 205.17 | 213.18 | 222.65 | 230.66 |
| Camarilla | 198.91 | 200.52 | 202.12 | 203.72 | 205.32 | 206.93 | 208.53 |
| Woodie | 177.50 | 187.33 | 194.98 | 204.81 | 212.46 | 222.29 | 229.94 |
| Fibonacci | 187.69 | 194.36 | 198.49 | 205.17 | 211.84 | 215.97 | 222.65 |
Numerical data
The following are the details of the technical indicators and moving averages that were collected to generate this technical analysis:
| RSI (14): | 56.64 | |
| MACD (12,26,9): | -0.6000 | |
| Directional Movement: | 8.11 | |
| AROON (14): | 92.86 | |
| DEMA (21): | 180.45 | |
| Parabolic SAR (0,02-0,02-0,2): | 177.65 | |
| Elder Ray (13): | 1.43 | |
| Super Trend (3,10): | 184.53 | |
| Zig ZAG (10): | 183.90 | |
| VORTEX (21): | 1.0300 | |
| Stochastique (14,3,5): | 79.75 | |
| TEMA (21): | 181.83 | |
| Williams %R (14): | -7.16 | |
| Chande Momentum Oscillator (20): | 4.00 | |
| Repulse (5,40,3): | 2.5900 | |
| ROCnROLL: | -1 | |
| TRIX (15,9): | -0.0900 | |
| Courbe Coppock: | 0.47 |
| MA7: | 182.24 | |
| MA20: | 194.29 | |
| MA50: | 203.42 | |
| MA100: | 215.11 | |
| MAexp7: | 181.96 | |
| MAexp20: | 181.55 | |
| MAexp50: | 184.78 | |
| MAexp100: | 189.93 | |
| Price / MA7: | +1.29% | |
| Price / MA20: | -4.99% | |
| Price / MA50: | -9.26% | |
| Price / MA100: | -14.19% | |
| Price / MAexp7: | +1.42% | |
| Price / MAexp20: | +1.65% | |
| Price / MAexp50: | -0.13% | |
| Price / MAexp100: | -2.84% |
News
Don't forget to follow the news on BOEING COMPANY THE. At the time of publication of this analysis, the latest news was as follows:
-
 Exclusive: FAA administrator says Boeing emphasizes production over safety
-
Exclusive: FAA chief on issues around safety culture at Boeing | Nightly News Preview
-
Fmr Boeing whistleblower exposes company’s ongoing safety issues: ‘This is a real problem’
-
United Airlines sees fifth mechanical issue on Boeing planes #shorts
-
Where now for Boeing shares?
About author
Online


Add a comment
Comments
0 comments on the analysis BOEING COMPANY THE - 1H