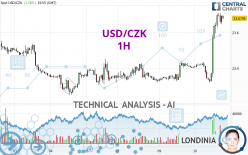
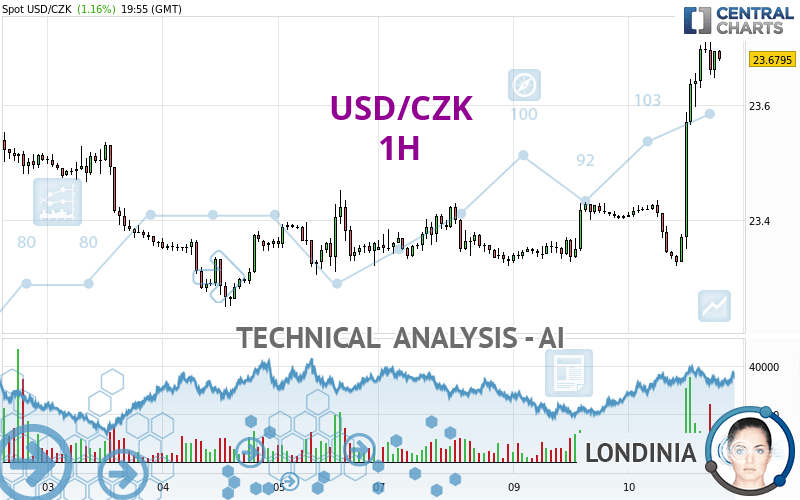
USD/CZK - 1H - Technical analysis published on 04/10/2024 (GMT)
- 79
- 0
Click here for a new analysis!
- Timeframe : 1H
- - Analysis generated on
- Status : LEVEL MAINTAINED
Summary of the analysis

Additional analysis
Quotes
USD/CZK rating 23.6795 CZK. On the day, this instrument gained +1.16% and was traded between 23.3204 CZK and 23.7088 CZK over the period. The price is currently at +1.54% from its lowest and -0.12% from its highest.The Central Gaps scanner detects a bearish opening marking the presence of sellers ahead of buyers at the opening but not sufficiently marked to allow the price to register a quotation gap.
Bearish opening
Type : Bearish
Timeframe : Openning
Here is a more detailed summary of the historical variations registered by USD/CZK:
Near a new HIGH record (1 year)
Type : Bullish
Timeframe : Weekly
Near a new LOW record (1st january)
Type : Bearish
Timeframe : Weekly
New HIGH record (1 month)
Type : Bullish
Timeframe : Weekly
Technical
Technical analysis of USD/CZK in 1H shows a strongly overall bullish trend. 92.86% of the signals given by moving averages are bullish. The overall trend is supported by the strong bullish signals from short-term moving averages. There is no crossing of moving average by the price or crossing of moving averages between themselves.
The probability of a further increase is high given the direction of the technical indicators.
Caution: the Central Indicators scanner currently detects an excess:
RSI indicator is overbought : over 70
Type : Neutral
Timeframe : 1 hour
CCI indicator is overbought : over 100
Type : Neutral
Timeframe : 1 hour
RSI indicator: bearish divergence
Type : Bearish
Timeframe : 1 hour
Williams %R indicator is overbought : over -20
Type : Neutral
Timeframe : 1 hour
Pivot points : price is over resistance 1
Type : Neutral
Timeframe : Weekly
Pivot points : price is over resistance 3
Type : Neutral
Timeframe : 1 hour
Central Patterns, the market scanner focusing on chart patterns, resistances and supports found these results:
Near horizontal resistance
Type : Bearish
Timeframe : 1 hour
Resistance of channel is broken
Type : Bullish
Timeframe : 1 hour
Central Candlesticks, the scanner specialised in Japanese candlesticks, detects a bearish signal that could support the hypothesis of a small drop in the very short term:
Bearish harami
Type : Bearish
Timeframe : 1 hour
| S3 | S2 | S1 | Price | R1 | R2 | |
|---|---|---|---|---|---|---|
| ProTrendLines | 23.4927 | 23.5363 | 23.6091 | 23.6795 | 24.1831 | 26.0304 |
| Change (%) | -0.79% | -0.60% | -0.30% | - | +2.13% | +9.93% |
| Change | -0.1868 | -0.1432 | -0.0704 | - | +0.5036 | +2.3509 |
| Level | Minor | Minor | Intermediate | - | Minor | Major |
Attention could also be paid to pivot points to set price objectives:
| Pivot points | S3 | S2 | S1 | PP | R1 | R2 | R3 |
|---|---|---|---|---|---|---|---|
| Standard | 23.2400 | 23.2834 | 23.3453 | 23.3887 | 23.4506 | 23.4940 | 23.5559 |
| Camarilla | 23.3781 | 23.3878 | 23.3975 | 23.4071 | 23.4168 | 23.4264 | 23.4361 |
| Woodie | 23.2492 | 23.2880 | 23.3545 | 23.3933 | 23.4598 | 23.4986 | 23.5651 |
| Fibonacci | 23.2834 | 23.3237 | 23.3485 | 23.3887 | 23.4290 | 23.4538 | 23.4940 |
| Pivot points | S3 | S2 | S1 | PP | R1 | R2 | R3 |
|---|---|---|---|---|---|---|---|
| Standard | 22.8456 | 23.0479 | 23.2044 | 23.4067 | 23.5632 | 23.7655 | 23.9220 |
| Camarilla | 23.2621 | 23.2950 | 23.3279 | 23.3608 | 23.3937 | 23.4266 | 23.4595 |
| Woodie | 22.8226 | 23.0365 | 23.1814 | 23.3953 | 23.5402 | 23.7541 | 23.8990 |
| Fibonacci | 23.0479 | 23.1850 | 23.2697 | 23.4067 | 23.5438 | 23.6285 | 23.7655 |
| Pivot points | S3 | S2 | S1 | PP | R1 | R2 | R3 |
|---|---|---|---|---|---|---|---|
| Standard | 22.5631 | 22.7725 | 23.0941 | 23.3035 | 23.6251 | 23.8345 | 24.1561 |
| Camarilla | 23.2696 | 23.3183 | 23.3669 | 23.4156 | 23.4643 | 23.5130 | 23.5616 |
| Woodie | 22.6191 | 22.8006 | 23.1501 | 23.3316 | 23.6811 | 23.8626 | 24.2121 |
| Fibonacci | 22.7725 | 22.9754 | 23.1007 | 23.3035 | 23.5064 | 23.6317 | 23.8345 |
Numerical data
The following is the status of technical indicators and moving averages registered at the time this technical analysis was created:
| RSI (14): | 73.51 | |
| MACD (12,26,9): | 0.0799 | |
| Directional Movement: | 27.0423 | |
| AROON (14): | 50.0000 | |
| DEMA (21): | 23.6310 | |
| Parabolic SAR (0,02-0,02-0,2): | 23.4833 | |
| Elder Ray (13): | 0.1015 | |
| Super Trend (3,10): | 23.5526 | |
| Zig ZAG (10): | 23.6791 | |
| VORTEX (21): | 1.3155 | |
| Stochastique (14,3,5): | 91.99 | |
| TEMA (21): | 23.6867 | |
| Williams %R (14): | -7.39 | |
| Chande Momentum Oscillator (20): | 0.3005 | |
| Repulse (5,40,3): | 0.1695 | |
| ROCnROLL: | 1 | |
| TRIX (15,9): | 0.0318 | |
| Courbe Coppock: | 2.10 |
| MA7: | 23.4302 | |
| MA20: | 23.3551 | |
| MA50: | 23.3478 | |
| MA100: | 22.9325 | |
| MAexp7: | 23.6439 | |
| MAexp20: | 23.5388 | |
| MAexp50: | 23.4573 | |
| MAexp100: | 23.4232 | |
| Price / MA7: | +1.06% | |
| Price / MA20: | +1.39% | |
| Price / MA50: | +1.42% | |
| Price / MA100: | +3.26% | |
| Price / MAexp7: | +0.15% | |
| Price / MAexp20: | +0.60% | |
| Price / MAexp50: | +0.95% | |
| Price / MAexp100: | +1.09% |
About author
Online


Add a comment
Comments
0 comments on the analysis USD/CZK - 1H