FTSE 100 - FTSE100 Bounced off the 50-daily SMA - 02/06/2017 (GMT)
- Who voted?
- 767
- 0
- Timeframe : Daily

FTSE 100 Chart
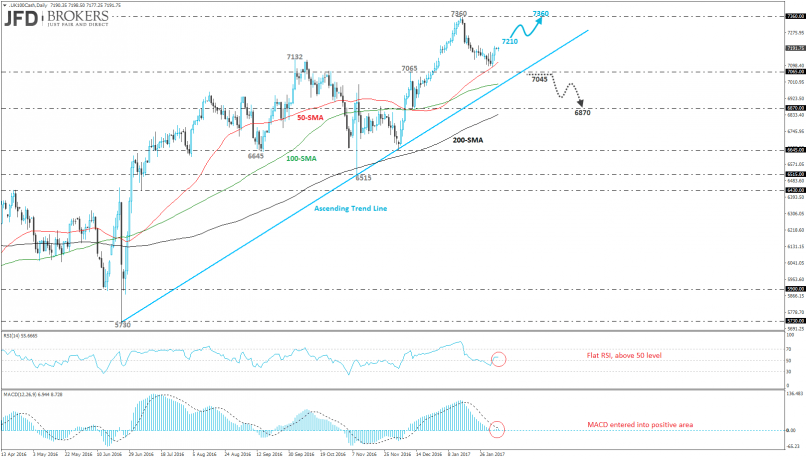
The pressure in the FTSE100 that was holding over the previous periods seems came to an end as the price had a rebound on the 50-daily SMA during the week before. Since February 1st, the index climbed more than 1% and is still trading in an ascending move.
Now, the price is moving near the 7188 price level and is possible to test the previous all-time high at 7360 strong resistance obstacle. Otherwise, if the price breaks the uptrend line to the downside, it will meet the 6870 barrier. On the daily chart, the moving averages are following an upward potential move as all of them (50, 100 and 200 SMAs) are acting as strong supports. Technically, RSI lies above its mid-level but is moving parallel with 50 level while MACD has just entered the positive path with some weak momentum.
Now, the price is moving near the 7188 price level and is possible to test the previous all-time high at 7360 strong resistance obstacle. Otherwise, if the price breaks the uptrend line to the downside, it will meet the 6870 barrier. On the daily chart, the moving averages are following an upward potential move as all of them (50, 100 and 200 SMAs) are acting as strong supports. Technically, RSI lies above its mid-level but is moving parallel with 50 level while MACD has just entered the positive path with some weak momentum.
This member did not declare if he had a position on this financial instrument or a related financial instrument.
About author

Offline


Add a comment
Comments
0 comments on the analysis FTSE 100 - Daily