Technical analyses - FTSE 100 - English
You are currently viewing all technical analyses of the financial instrument FTSE 100 regarding all markets in English regarding all markets, sorted by Latest comments.
Sort : Latest comments | Latest posted


- 101
- 836
- 1878
- 0

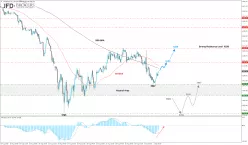
Timeframe : 4H - Simple chart
- 25
- 127
- 302
- 4

Timeframe : Daily - Simple chart
- 101
- 836
- 1878
- 0

Timeframe : Daily - Simple chart
- 101
- 836
- 1878
- 0

Timeframe : Daily - Simple chart
- 101
- 836
- 1878
- 0

Timeframe : Daily - Simple chart
- 101
- 836
- 1878
- 0

Timeframe : Daily - Simple chart
- 25
- 127
- 302
- 4

Timeframe : Daily - Simple chart
- 25
- 127
- 302
- 4

Timeframe : Daily - Simple chart
- 101
- 836
- 1878
- 0

Timeframe : 4H - Simple chart
- 101
- 836
- 1878
- 0

Timeframe : 4H - Simple chart