FTSE 100 - is Moving Slightly Lower After Another Fresh All-Time High - 06/05/2017 (GMT)
- Who voted?
- 1018
- 0
- Timeframe : Daily
FTSE 100 Chart
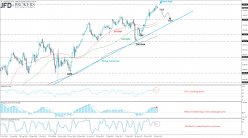
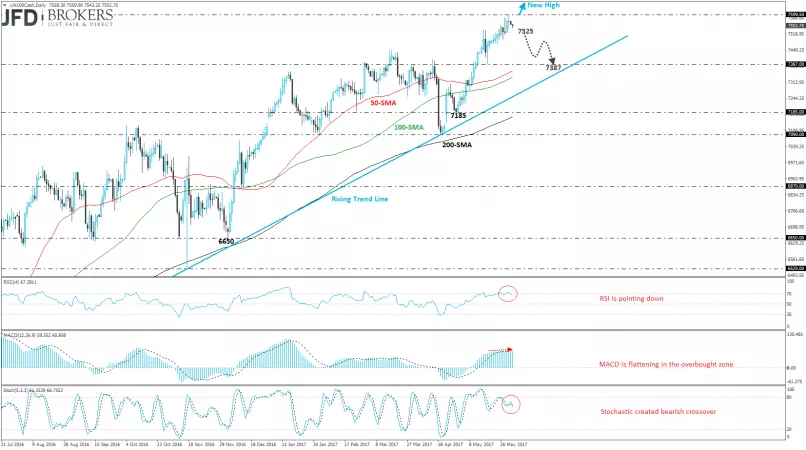
The FTSE 100 index had an aggressive bullish run since the previous month as it added more than 4.5% at its value. The price printed a fresh all-time high during previous week’s session at 7599.50 while the ascending trend is holding since February of 2016. The index completed six winning weeks in a row and we are waiting for a further upside move. In the case of a retracement, a slip at 7387.00 is possible.
Going to the daily timeframe, the price is developing well above the three simple moving averages (50, 100 and 200) indicating for bullish tendency. However, the U.K. 100 index started a bearish move while the technical indicators reversed from the overbought areas. The RSI indicator is sloping to the downside and the MACD oscillator is flattening with the trigger line in the positive path. Also, the stochastic oscillator is endorsing the bearish scenario as it is pointing to the south.
Going to the daily timeframe, the price is developing well above the three simple moving averages (50, 100 and 200) indicating for bullish tendency. However, the U.K. 100 index started a bearish move while the technical indicators reversed from the overbought areas. The RSI indicator is sloping to the downside and the MACD oscillator is flattening with the trigger line in the positive path. Also, the stochastic oscillator is endorsing the bearish scenario as it is pointing to the south.
This member did not declare if he had a position on this financial instrument or a related financial instrument.
About author

Offline


Add a comment
Comments
0 comments on the analysis FTSE 100 - Daily