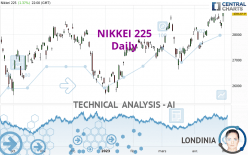
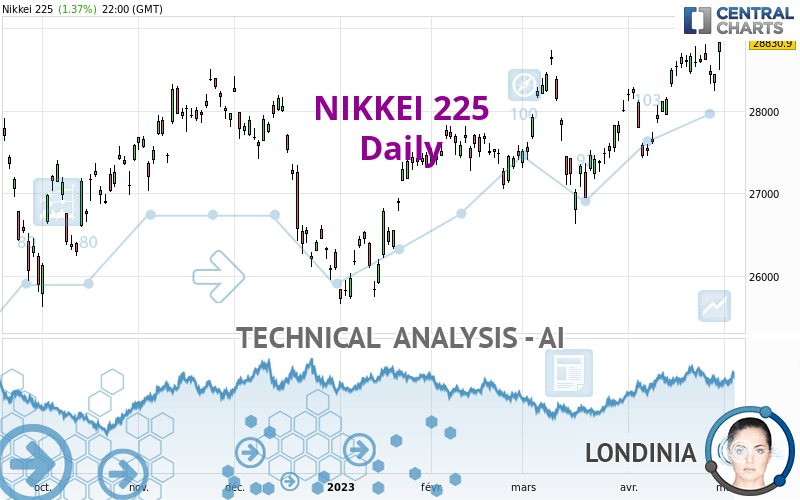
NIKKEI 225 - Daily - Technical analysis published on 05/17/2023 (GMT)
- 170
- 0
Click here for a new analysis!
- Timeframe : Daily
- - Analysis generated on
- Status : TARGET REACHED
Summary of the analysis

Additional analysis
Quotes
The NIKKEI 225 price is 30,079.70 JPY. On the day, this instrument gained +0.76% and was between 29,912.40 JPY and 30,115.30 JPY. This implies that the price is at +0.56% from its lowest and at -0.12% from its highest.The Central Gaps scanner detects the formation of a bullish gap marking the strong presence of buyers against sellers at the opening. This formed a quotation gap.
Opening Gap UP
Type : Bullish
Timeframe : Openning
So that you have an overall view of the price change, here is a table showing the variations over several periods:
Near a new HIGH record (5 years)
Type : Bullish
Timeframe : Weekly
New HIGH record (1 year)
Type : Bullish
Timeframe : Weekly
New HIGH record (1st january)
Type : Bullish
Timeframe : Weekly
New HIGH record (1 month)
Type : Bullish
Timeframe : Weekly
Technical
Technical analysis of NIKKEI 225 in Daily shows a strongly overall bullish trend. 92.86% of the signals given by moving averages are bullish. The overall trend is supported by the strong bullish signals from short-term moving averages. There is no crossing of moving average by the price or crossing of moving averages between themselves.
In fact, according to the parameters integrated into the Central Analyzer system, 16 technical indicators out of 18 analysed are currently bullish. Caution: the Central Indicators scanner currently detects an excess:
RSI indicator is overbought : over 70
Type : Neutral
Timeframe : Daily
CCI indicator is overbought : over 100
Type : Neutral
Timeframe : Daily
Williams %R indicator is overbought : over -20
Type : Neutral
Timeframe : Daily
Pivot points : price is over resistance 2
Type : Neutral
Timeframe : Weekly
Pivot points : price is over resistance 3
Type : Neutral
Timeframe : Daily
No signals are given by Central Patterns, a market scanner specialised in chart patterns, resistances and supports.
Central Candlesticks, the scanner specialised in Japanese candlesticks, detects a bullish signal that could support the hypothesis of a small rebound in the very short term:
Upside gap
Type : Bullish
Timeframe : Daily
| S3 | S2 | S1 | Price | R1 | |
|---|---|---|---|---|---|
| ProTrendLines | 27,437.40 | 28,638.10 | 29,191.50 | 30,079.70 | 30,568.90 |
| Change (%) | -8.78% | -4.79% | -2.95% | - | +1.63% |
| Change | -2,642.30 | -1,441.60 | -888.20 | - | +489.20 |
| Level | Minor | Major | Major | - | Intermediate |
Attention could also be paid to pivot points to set price objectives:
| Pivot points | S3 | S2 | S1 | PP | R1 | R2 | R3 |
|---|---|---|---|---|---|---|---|
| Standard | 29,753.40 | 29,832.90 | 29,956.30 | 30,035.80 | 30,159.20 | 30,238.70 | 30,362.10 |
| Camarilla | 30,023.90 | 30,042.50 | 30,061.10 | 30,079.70 | 30,098.30 | 30,116.90 | 30,135.50 |
| Woodie | 29,775.35 | 29,843.88 | 29,978.25 | 30,046.78 | 30,181.15 | 30,249.68 | 30,384.05 |
| Fibonacci | 29,832.90 | 29,910.41 | 29,958.29 | 30,035.80 | 30,113.31 | 30,161.19 | 30,238.70 |
| Pivot points | S3 | S2 | S1 | PP | R1 | R2 | R3 |
|---|---|---|---|---|---|---|---|
| Standard | 28,604.80 | 28,768.31 | 29,092.81 | 29,256.32 | 29,580.82 | 29,744.33 | 30,068.83 |
| Camarilla | 29,283.12 | 29,327.85 | 29,372.59 | 29,417.32 | 29,462.05 | 29,506.79 | 29,551.52 |
| Woodie | 28,685.31 | 28,808.56 | 29,173.32 | 29,296.57 | 29,661.33 | 29,784.58 | 30,149.34 |
| Fibonacci | 28,768.31 | 28,954.73 | 29,069.90 | 29,256.32 | 29,442.74 | 29,557.91 | 29,744.33 |
| Pivot points | S3 | S2 | S1 | PP | R1 | R2 | R3 |
|---|---|---|---|---|---|---|---|
| Standard | 26,489.46 | 26,958.56 | 27,894.73 | 28,363.83 | 29,300.00 | 29,769.10 | 30,705.27 |
| Camarilla | 28,444.45 | 28,573.27 | 28,702.08 | 28,830.90 | 28,959.72 | 29,088.53 | 29,217.35 |
| Woodie | 26,723.00 | 27,075.33 | 28,128.27 | 28,480.60 | 29,533.54 | 29,885.87 | 30,938.81 |
| Fibonacci | 26,958.56 | 27,495.37 | 27,827.02 | 28,363.83 | 28,900.64 | 29,232.29 | 29,769.10 |
Numerical data
The following are the details of the technical indicators and moving averages that were collected to generate this technical analysis:
| RSI (14): | 74.47 | |
| MACD (12,26,9): | 408.3500 | |
| Directional Movement: | 33.44 | |
| AROON (14): | 71.43 | |
| DEMA (21): | 29,443.73 | |
| Parabolic SAR (0,02-0,02-0,2): | 28,715.73 | |
| Elder Ray (13): | 694.87 | |
| Super Trend (3,10): | 29,105.35 | |
| Zig ZAG (10): | 29,852.90 | |
| VORTEX (21): | 1.2200 | |
| Stochastique (14,3,5): | 98.25 | |
| TEMA (21): | 29,617.38 | |
| Williams %R (14): | -3.80 | |
| Chande Momentum Oscillator (20): | 1,240.70 | |
| Repulse (5,40,3): | 0.9400 | |
| ROCnROLL: | 1 | |
| TRIX (15,9): | 0.1700 | |
| Courbe Coppock: | 5.93 |
| MA7: | 29,335.64 | |
| MA20: | 28,903.25 | |
| MA50: | 28,214.12 | |
| MA100: | 27,582.61 | |
| MAexp7: | 29,399.66 | |
| MAexp20: | 28,932.89 | |
| MAexp50: | 28,369.76 | |
| MAexp100: | 27,957.20 | |
| Price / MA7: | +2.54% | |
| Price / MA20: | +4.07% | |
| Price / MA50: | +6.61% | |
| Price / MA100: | +9.05% | |
| Price / MAexp7: | +2.31% | |
| Price / MAexp20: | +3.96% | |
| Price / MAexp50: | +6.03% | |
| Price / MAexp100: | +7.59% |
News
The last news published on NIKKEI 225 at the time of the generation of this analysis was as follows:
-
 Nikkei 225 Forecast January 25, 2023
-
Nikkei 225 Forecast January 4, 2023
-
Nikkei 225 Forecast September 28, 2022
-
DAX and Nikkei 225 Forecast July 13, 2022
-
DAX and Nikkei 225 Forecast June 28, 2022
About author

Online


Add a comment
Comments
0 comments on the analysis NIKKEI 225 - Daily