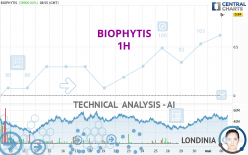
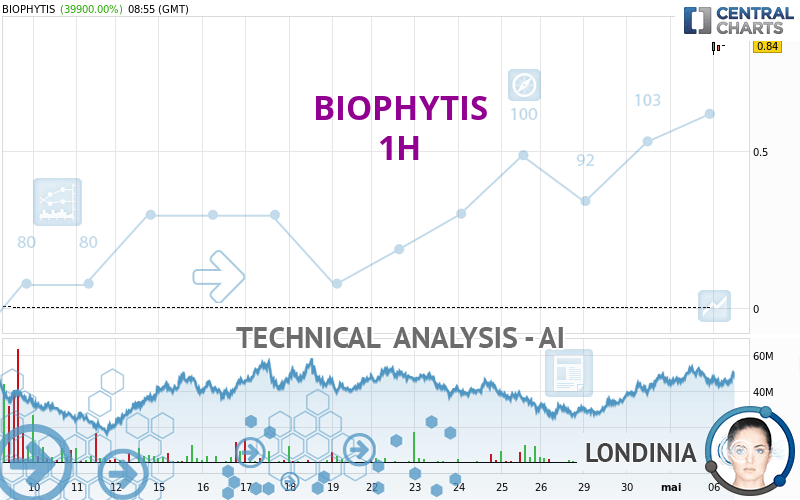
BIOPHYTIS - 1H - Technical analysis published on 05/06/2024 (GMT)
- 84
- 0
Click here for a new analysis!
- Timeframe : 1H
- - Analysis generated on
- Status : LEVEL MAINTAINED
Summary of the analysis

Additional analysis
Quotes
BIOPHYTIS rating 0.8200 EUR. The price has increased by +38,947.62% since the last closing and was traded between 0.8100 EUR and 0.8500 EUR over the period. The price is currently at +1.23% from its lowest and -3.53% from its highest.The Central Gaps scanner detects the formation of a bullish gap marking the strong presence of buyers against sellers at the opening. This formed a quotation gap.
Opening Gap UP
Type : Bullish
Timeframe : Openning
Here is a more detailed summary of the historical variations registered by BIOPHYTIS:
New HIGH record (1 year)
Type : Bullish
Timeframe : Weekly
New HIGH record (1st january)
Type : Bullish
Timeframe : Weekly
New HIGH record (1 month)
Type : Bullish
Timeframe : Weekly
The Central Volumes scanner notes the presence of abnormal volumes:
Abnormal volumes
Timeframe : 20 days
Abnormal volumes
Timeframe : 50 days
Technical
Technical analysis of BIOPHYTIS in 1H shows a strongly overall bullish trend. 92.86% of the signals given by moving averages are bullish. This strongly bullish trend is supported by the strong bullish signals given by short-term moving averages. An assessment of moving averages reveals several bullish signals that could impact this trend:
Bullish trend reversal : Moving Average 20
Type : Bullish
Timeframe : 1 hour
Bullish trend reversal : Moving Average 50
Type : Bullish
Timeframe : 1 hour
Bullish trend reversal : Moving Average 100
Type : Bullish
Timeframe : 1 hour
Bullish trend reversal : adaptative moving average 20
Type : Bullish
Timeframe : 1 hour
Bullish trend reversal : adaptative moving average 50
Type : Bullish
Timeframe : 1 hour
Bullish trend reversal : adaptative moving average 100
Type : Bullish
Timeframe : 1 hour
In fact, according to the parameters integrated into the Central Analyzer system, 16 technical indicators out of 18 analysed are currently bullish. Caution: the Central Indicators scanner currently detects an excess:
RSI indicator is overbought : over 90
Type : Neutral
Timeframe : 1 hour
CCI indicator is overbought : over 100
Type : Neutral
Timeframe : 1 hour
Previous candle closed over Bollinger bands
Type : Neutral
Timeframe : 1 hour
Williams %R indicator is overbought : over -20
Type : Neutral
Timeframe : 1 hour
Pivot points : price is over resistance 3
Type : Neutral
Timeframe : 1 hour
Pivot points : price is over resistance 3
Type : Neutral
Timeframe : Weekly
An analysis of the price chart with the Central Patterns scanner (detector of chart patterns and resistances and supports) shows a result that can have an impact on the price change:
Resistance of channel is broken
Type : Bullish
Timeframe : 1 hour
For a small setback in the very short term, the Central Candlesticks scanner currently notes the presence of this bearish pattern in Japanese candlesticks:
Black marubozu
Type : Bearish
Timeframe : 1 hour
Long black line
Type : Bearish
Timeframe : 1 hour
| S3 | S2 | S1 | Price | R1 | R2 | R3 | |
|---|---|---|---|---|---|---|---|
| ProTrendLines | 0.0144 | 0.1360 | 0.7047 | 0.8200 | 1.1700 | 1.6880 | 2.6100 |
| Change (%) | -98.24% | -83.41% | -14.06% | - | +42.68% | +105.85% | +218.29% |
| Change | -0.8056 | -0.6840 | -0.1153 | - | +0.3500 | +0.8680 | +1.7900 |
| Level | Major | Intermediate | Minor | - | Minor | Major | Intermediate |
To determine price objectives, it is also possible to use the pivot points. Here is the price position in relation to pivot points:
| Pivot points | S3 | S2 | S1 | PP | R1 | R2 | R3 |
|---|---|---|---|---|---|---|---|
| Standard | 0.0017 | 0.0019 | 0.0020 | 0.0022 | 0.0023 | 0.0025 | 0.0026 |
| Camarilla | 0.0020 | 0.0021 | 0.0021 | 0.0021 | 0.0021 | 0.0022 | 0.0022 |
| Woodie | 0.0017 | 0.0019 | 0.0020 | 0.0022 | 0.0023 | 0.0025 | 0.0026 |
| Fibonacci | 0.0019 | 0.0020 | 0.0021 | 0.0022 | 0.0023 | 0.0024 | 0.0025 |
| Pivot points | S3 | S2 | S1 | PP | R1 | R2 | R3 |
|---|---|---|---|---|---|---|---|
| Standard | -0.0008 | 0.0006 | 0.0014 | 0.0028 | 0.0036 | 0.0050 | 0.0058 |
| Camarilla | 0.0015 | 0.0017 | 0.0019 | 0.0021 | 0.0023 | 0.0025 | 0.0027 |
| Woodie | -0.0012 | 0.0005 | 0.0010 | 0.0027 | 0.0032 | 0.0049 | 0.0054 |
| Fibonacci | 0.0006 | 0.0015 | 0.0020 | 0.0028 | 0.0037 | 0.0042 | 0.0050 |
Numerical data
The following are the details of the technical indicators and moving averages that were collected to generate this technical analysis:
| RSI (14): | 99.93 | |
| MACD (12,26,9): | 0.1156 | |
| Directional Movement: | 97.3372 | |
| AROON (14): | 71.4285 | |
| DEMA (21): | 0.2670 | |
| Parabolic SAR (0,02-0,02-0,2): | 0.0021 | |
| Elder Ray (13): | 0.6108 | |
| Super Trend (3,10): | 0.5948 | |
| Zig ZAG (10): | 0.8200 | |
| VORTEX (21): | 1.0111 | |
| Stochastique (14,3,5): | 64.31 | |
| TEMA (21): | 0.3731 | |
| Williams %R (14): | -3.54 | |
| Chande Momentum Oscillator (20): | 0.8178 | |
| Repulse (5,40,3): | -8.7300 | |
| ROCnROLL: | 1 | |
| TRIX (15,9): | 107.8384 | |
| Courbe Coppock: | 25,998.85 |
| MA7: | 0.1191 | |
| MA20: | 0.0433 | |
| MA50: | 0.0196 | |
| MA100: | 0.0124 | |
| MAexp7: | 0.3600 | |
| MAexp20: | 0.1506 | |
| MAexp50: | 0.0652 | |
| MAexp100: | 0.0345 | |
| Price / MA7: | +588.50% | |
| Price / MA20: | +1,793.76% | |
| Price / MA50: | +4,083.67% | |
| Price / MA100: | +6,512.90% | |
| Price / MAexp7: | +127.78% | |
| Price / MAexp20: | +444.49% | |
| Price / MAexp50: | +1,157.67% | |
| Price / MAexp100: | +2,276.81% |
News
Don't forget to follow the news on BIOPHYTIS. At the time of publication of this analysis, the latest news was as follows:
- BIOPHYTIS Announces Successful Completion of SARA-PK Clinical Study for Sarconeos in Sarcopenia Confirming Safety Profile
- BIOPHYTIS received regulatory authorizations to conduct SARA-OBS study in sarcopenia patients
- BIOPHYTIS Presenting Four Posters on Sarconeos at 9th International Conference on Cachexia, Sarcopenia, and Muscle Wasting
- BIOPHYTIS chooses Patheon to produce the clinical batches of Macuneos, its AMD drug candidate that will enter Phase 2B
About author
Online


Add a comment
Comments
0 comments on the analysis BIOPHYTIS - 1H