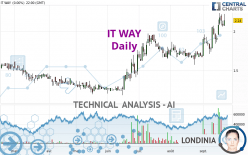
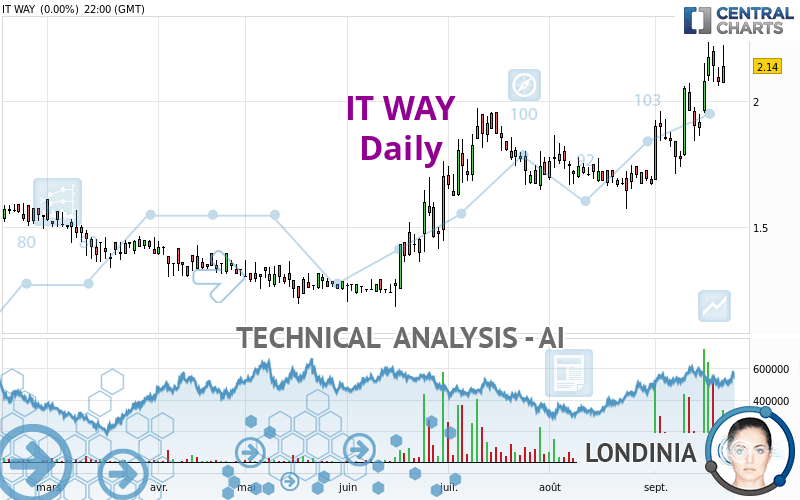
IT WAY - Daily - Technical analysis published on 09/22/2023 (GMT)
- 111
- 0
Click here for a new analysis!
- Timeframe : Daily
- - Analysis generated on
- Status : INVALID
Summary of the analysis

Additional analysis
Quotes
The IT WAY rating is 2.280 EUR. The price has increased by +6.54% since the last closing with the lowest point at 2.145 EUR and the highest point at 2.300 EUR. The deviation from the price is +6.29% for the low point and -0.87% for the high point.The Central Gaps scanner detects a bullish opening marking the presence of buyers ahead of sellers at the opening but not sufficiently marked to allow the price to register a quotation gap.
Bullish opening
Type : Bullish
Timeframe : Openning
Here is a more detailed summary of the historical variations registered by IT WAY:
Near a new HIGH record (1 year)
Type : Bullish
Timeframe : Weekly
Near a new HIGH record (1st january)
Type : Bullish
Timeframe : Weekly
Near a new HIGH record (1 month)
Type : Bullish
Timeframe : Weekly
The Central Volumes scanner detects abnormal volumes on the asset:
Abnormal volumes
Timeframe : 5 days
Abnormal volumes
Timeframe : 20 days
Abnormal volumes
Timeframe : 50 days
Technical
Technical analysis of this Daily chart of IT WAY indicates that the overall trend is strongly bullish. 92.86% of the signals given by moving averages are bullish. This strongly bullish trend is supported by the strong bullish signals given by short-term moving averages. There is no crossing of moving average by the price or crossing of moving averages between themselves.
An assessment of technical indicators shows a strong bullish signal.
Caution: the Central Indicators scanner currently detects an excess:
CCI indicator is overbought : over 100
Type : Neutral
Timeframe : Daily
Williams %R indicator is overbought : over -20
Type : Neutral
Timeframe : Daily
Pivot points : price is over resistance 1
Type : Neutral
Timeframe : Daily
The Central Patterns scanner, which studies chart patterns, resistances and supports, has identified these signals:
Near resistance of channel
Type : Bearish
Timeframe : Daily
Near horizontal support
Type : Bullish
Timeframe : Daily
Central Candlesticks, the scanner specialised in Japanese candlesticks, detects this inversion signal that could impact the current short-term trend:
Doji
Type : Neutral
Timeframe : Daily
| S3 | S2 | S1 | Price | R1 | R2 | R3 | |
|---|---|---|---|---|---|---|---|
| ProTrendLines | 1.718 | 1.912 | 2.150 | 2.280 | 2.500 | 2.840 | 3.190 |
| Change (%) | -24.65% | -16.14% | -5.70% | - | +9.65% | +24.56% | +39.91% |
| Change | -0.562 | -0.368 | -0.130 | - | +0.220 | +0.560 | +0.910 |
| Level | Minor | Major | Intermediate | - | Minor | Minor | Major |
To determine price objectives, it is also possible to use the pivot points. Here is the price position in relation to pivot points:
| Pivot points | S3 | S2 | S1 | PP | R1 | R2 | R3 |
|---|---|---|---|---|---|---|---|
| Standard | 1.910 | 1.990 | 2.065 | 2.145 | 2.220 | 2.300 | 2.375 |
| Camarilla | 2.097 | 2.112 | 2.126 | 2.140 | 2.154 | 2.168 | 2.183 |
| Woodie | 1.908 | 1.989 | 2.063 | 2.144 | 2.218 | 2.299 | 2.373 |
| Fibonacci | 1.990 | 2.049 | 2.086 | 2.145 | 2.204 | 2.241 | 2.300 |
| Pivot points | S3 | S2 | S1 | PP | R1 | R2 | R3 |
|---|---|---|---|---|---|---|---|
| Standard | 1.487 | 1.633 | 1.857 | 2.003 | 2.227 | 2.373 | 2.597 |
| Camarilla | 1.978 | 2.012 | 2.046 | 2.080 | 2.114 | 2.148 | 2.182 |
| Woodie | 1.525 | 1.653 | 1.895 | 2.023 | 2.265 | 2.393 | 2.635 |
| Fibonacci | 1.633 | 1.775 | 1.862 | 2.003 | 2.145 | 2.232 | 2.373 |
| Pivot points | S3 | S2 | S1 | PP | R1 | R2 | R3 |
|---|---|---|---|---|---|---|---|
| Standard | 1.241 | 1.405 | 1.537 | 1.701 | 1.833 | 1.997 | 2.129 |
| Camarilla | 1.587 | 1.614 | 1.641 | 1.668 | 1.695 | 1.722 | 1.749 |
| Woodie | 1.224 | 1.397 | 1.520 | 1.693 | 1.816 | 1.989 | 2.112 |
| Fibonacci | 1.405 | 1.518 | 1.588 | 1.701 | 1.814 | 1.884 | 1.997 |
Numerical data
The following are the details of the technical indicators and moving averages that were collected to generate this technical analysis:
| RSI (14): | 69.93 | |
| MACD (12,26,9): | 0.1170 | |
| Directional Movement: | 24.980 | |
| AROON (14): | 78.571 | |
| DEMA (21): | 2.112 | |
| Parabolic SAR (0,02-0,02-0,2): | 1.974 | |
| Elder Ray (13): | 0.184 | |
| Super Trend (3,10): | 1.837 | |
| Zig ZAG (10): | 2.280 | |
| VORTEX (21): | 1.1940 | |
| Stochastique (14,3,5): | 83.16 | |
| TEMA (21): | 2.182 | |
| Williams %R (14): | -3.39 | |
| Chande Momentum Oscillator (20): | 0.440 | |
| Repulse (5,40,3): | 7.1070 | |
| ROCnROLL: | 1 | |
| TRIX (15,9): | 0.6590 | |
| Courbe Coppock: | 37.83 |
| MA7: | 2.115 | |
| MA20: | 1.927 | |
| MA50: | 1.816 | |
| MA100: | 1.613 | |
| MAexp7: | 2.122 | |
| MAexp20: | 1.973 | |
| MAexp50: | 1.826 | |
| MAexp100: | 1.704 | |
| Price / MA7: | +7.80% | |
| Price / MA20: | +18.32% | |
| Price / MA50: | +25.55% | |
| Price / MA100: | +41.35% | |
| Price / MAexp7: | +7.45% | |
| Price / MAexp20: | +15.56% | |
| Price / MAexp50: | +24.86% | |
| Price / MAexp100: | +33.80% |
News
The last news published on IT WAY at the time of the generation of this analysis was as follows:
- Cognosec AB (Publ): Cognosec completes acquisition of ITWAY's Cyber Security Value Added Distributor interests in Turkey and Greece
- Cognosec AB (Publ): Cognosec enters into an exclusive agreement to acquire ITWAY's Cyber Security Value Added Distributor interests in Turkey and Greece for €10 million
-
 Fake News Finds It Way In A Story About Lebron James
-
IT Way
-
IT Way
About author
Online


Add a comment
Comments
0 comments on the analysis IT WAY - Daily