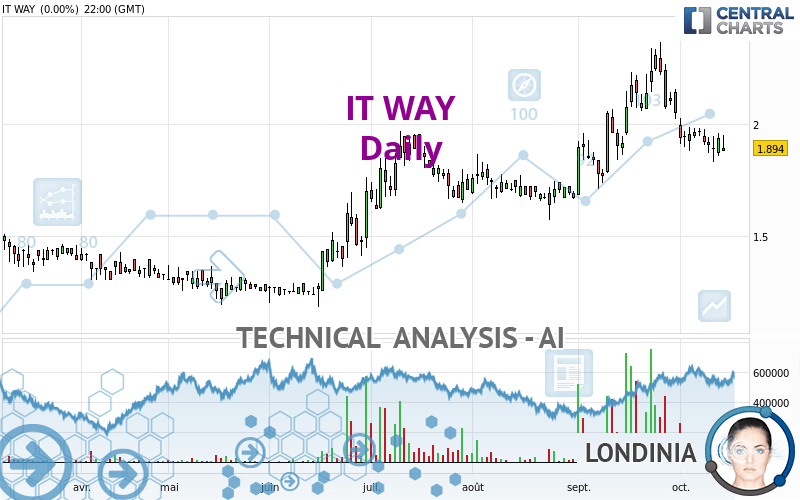
IT WAY - Daily - Technical analysis published on 10/16/2023 (GMT)
- 99
- 0
Click here for a new analysis!
- Timeframe : Daily
- - Analysis generated on
- Status : INVALID

Summary of the analysis

Additional analysis
Quotes
The IT WAY rating is 2.065 EUR. On the day, this instrument gained +9.03% and was between 1.880 EUR and 2.140 EUR. This implies that the price is at +9.84% from its lowest and at -3.50% from its highest.The Central Gaps scanner detects a bearish opening marking the presence of sellers ahead of buyers at the opening but not sufficiently marked to allow the price to register a quotation gap.
Bearish opening
Type : Bearish
Timeframe : Openning
Here is a more detailed summary of the historical variations registered by IT WAY:
Near a new LOW record (1 month)
Type : Bearish
Timeframe : Weekly
Abnormal volumes on IT WAY were detected by the Central Volumes scanner:
Abnormal volumes
Timeframe : 20 days
Abnormal volumes
Timeframe : 50 days
Technical
Technical analysis of this Daily chart of IT WAY indicates that the overall trend is strongly bullish. 89.29% of the signals given by moving averages are bullish. The slightly bullish signals given by the short-term moving averages show a weakening of the global trend. The Central Indicators scanner detects bullish signals on moving averages that could impact this trend:
Bullish price crossover with Moving Average 20
Type : Bullish
Timeframe : Daily
Bullish price crossover with adaptative moving average 20
Type : Bullish
Timeframe : Daily
In fact, according to the parameters integrated into the Central Analyzer system, 11 technical indicators out of 18 analysed are currently bullish. Central Indicators, the scanner specialised in technical indicators, has identified these signals:
Pivot points : price is over resistance 2
Type : Neutral
Timeframe : Weekly
Pivot points : price is over resistance 3
Type : Neutral
Timeframe : Daily
RSI indicator is back over 50
Type : Bullish
Timeframe : Daily
Parabolic SAR indicator bullish reversal
Type : Bullish
Timeframe : Daily
MACD indicator is back over 0
Type : Bullish
Timeframe : Daily
Momentum indicator is back over 0
Type : Bullish
Timeframe : Daily
Williams %R indicator is back over -50
Type : Bullish
Timeframe : Daily
No signals are given by Central Patterns, a market scanner specialised in chart patterns, resistances and supports.
The Central Candlesticks scanner which studies Japanese candlesticks did not detect anything.
| S3 | S2 | S1 | Price | R1 | R2 | R3 | |
|---|---|---|---|---|---|---|---|
| ProTrendLines | 1.659 | 1.788 | 1.912 | 2.065 | 2.150 | 2.310 | 2.500 |
| Change (%) | -19.66% | -13.41% | -7.41% | - | +4.12% | +11.86% | +21.07% |
| Change | -0.406 | -0.277 | -0.153 | - | +0.085 | +0.245 | +0.435 |
| Level | Intermediate | Minor | Major | - | Major | Major | Minor |
Pivot points can also be used to set your price objectives. Here is the price situation in relation to pivot points:
| Pivot points | S3 | S2 | S1 | PP | R1 | R2 | R3 |
|---|---|---|---|---|---|---|---|
| Standard | 1.794 | 1.838 | 1.866 | 1.910 | 1.938 | 1.982 | 2.010 |
| Camarilla | 1.874 | 1.881 | 1.887 | 1.894 | 1.901 | 1.907 | 1.914 |
| Woodie | 1.786 | 1.834 | 1.858 | 1.906 | 1.930 | 1.978 | 2.002 |
| Fibonacci | 1.838 | 1.866 | 1.883 | 1.910 | 1.938 | 1.955 | 1.982 |
| Pivot points | S3 | S2 | S1 | PP | R1 | R2 | R3 |
|---|---|---|---|---|---|---|---|
| Standard | 1.679 | 1.755 | 1.825 | 1.901 | 1.971 | 2.047 | 2.117 |
| Camarilla | 1.854 | 1.867 | 1.881 | 1.894 | 1.907 | 1.921 | 1.934 |
| Woodie | 1.675 | 1.754 | 1.821 | 1.900 | 1.967 | 2.046 | 2.113 |
| Fibonacci | 1.755 | 1.811 | 1.846 | 1.901 | 1.957 | 1.992 | 2.047 |
| Pivot points | S3 | S2 | S1 | PP | R1 | R2 | R3 |
|---|---|---|---|---|---|---|---|
| Standard | 1.013 | 1.349 | 1.699 | 2.035 | 2.385 | 2.721 | 3.071 |
| Camarilla | 1.861 | 1.924 | 1.987 | 2.050 | 2.113 | 2.176 | 2.239 |
| Woodie | 1.021 | 1.353 | 1.707 | 2.039 | 2.393 | 2.725 | 3.079 |
| Fibonacci | 1.349 | 1.611 | 1.773 | 2.035 | 2.297 | 2.459 | 2.721 |
Numerical data
The following is the status of the technical indicators and moving averages at the time of publication of this technical analysis:
| RSI (14): | 59.84 | |
| MACD (12,26,9): | 0.0100 | |
| Directional Movement: | 6.948 | |
| AROON (14): | -78.571 | |
| DEMA (21): | 2.008 | |
| Parabolic SAR (0,02-0,02-0,2): | 1.832 | |
| Elder Ray (13): | 0.026 | |
| Super Trend (3,10): | 2.199 | |
| Zig ZAG (10): | 2.135 | |
| VORTEX (21): | 0.9510 | |
| Stochastique (14,3,5): | 33.59 | |
| TEMA (21): | 1.967 | |
| Williams %R (14): | -30.82 | |
| Chande Momentum Oscillator (20): | 0.030 | |
| Repulse (5,40,3): | 16.3380 | |
| ROCnROLL: | 1 | |
| TRIX (15,9): | 0.1830 | |
| Courbe Coppock: | 18.35 |
| MA7: | 1.951 | |
| MA20: | 2.041 | |
| MA50: | 1.892 | |
| MA100: | 1.729 | |
| MAexp7: | 1.981 | |
| MAexp20: | 1.983 | |
| MAexp50: | 1.908 | |
| MAexp100: | 1.787 | |
| Price / MA7: | +5.84% | |
| Price / MA20: | +1.18% | |
| Price / MA50: | +9.14% | |
| Price / MA100: | +19.43% | |
| Price / MAexp7: | +4.24% | |
| Price / MAexp20: | +4.14% | |
| Price / MAexp50: | +8.23% | |
| Price / MAexp100: | +15.56% |
News
The last news published on IT WAY at the time of the generation of this analysis was as follows:
- Cognosec AB (Publ): Cognosec completes acquisition of ITWAY's Cyber Security Value Added Distributor interests in Turkey and Greece
- Cognosec AB (Publ): Cognosec enters into an exclusive agreement to acquire ITWAY's Cyber Security Value Added Distributor interests in Turkey and Greece for €10 million
-
 Fake News Finds It Way In A Story About Lebron James
-
IT Way
-
IT Way
About author
Online


Add a comment
Comments
0 comments on the analysis IT WAY - Daily