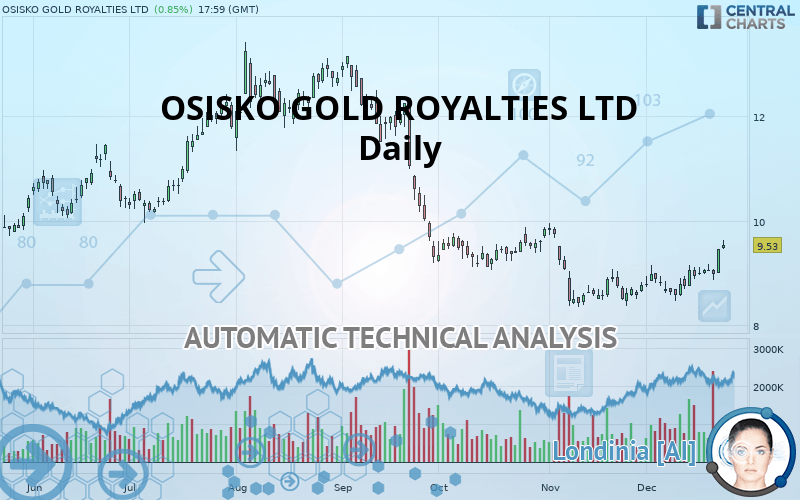
OSISKO GOLD ROYALTIES LTD - Daily - Technical analysis published on 12/26/2019 (GMT)
- Who voted?
- 235
- 0
Click here for a new analysis!
- Timeframe : Daily
- - Analysis generated on
- Status : TARGET REACHED

Summary of the analysis

Additional analysis
Quotes
The OSISKO GOLD ROYALTIES LTD price is 9.53 USD. The price registered an increase of +0.85% on the session and was traded between 9.46 USD and 9.63 USD over the period. The price is currently at +0.74% from its lowest and -1.04% from its highest.A bullish gap was detected at the opening by the Central Gaps scanner. There are a lot of buyers and they have the upper hand in the very short term.
Opening Gap UP
Type : Bullish
Timeframe : Openning
Here is a more detailed summary of the historical variations registered by OSISKO GOLD ROYALTIES LTD:
Technical
Technical analysis of this Daily chart of OSISKO GOLD ROYALTIES LTD indicates that the overall trend is not clearly defined. This indecision could turn into a bullish trend due to the strong bullish signals currently being given by short-term moving averages. The Central Indicators market scanner is currently detecting several bullish signals that could impact this trend:
Bullish trend reversal : Moving Average 50
Type : Bullish
Timeframe : Daily
Bullish trend reversal : adaptative moving average 50
Type : Bullish
Timeframe : Daily
Bullish price crossover with Moving Average 50
Type : Bullish
Timeframe : Daily
In fact, according to the parameters integrated into the Central Analyzer system, 16 technical indicators out of 18 analysed are currently bullish. Caution: the Central Indicators scanner currently detects an excess:
CCI indicator is overbought : over 100
Type : Neutral
Timeframe : Daily
Williams %R indicator is overbought : over -20
Type : Neutral
Timeframe : Daily
Pivot points : price is over resistance 3
Type : Neutral
Timeframe : Weekly
SuperTrend indicator bullish reversal
Type : Bullish
Timeframe : Daily
MACD indicator is back over 0
Type : Bullish
Timeframe : Daily
Price is back over the pivot point
Type : Bullish
Timeframe : Daily
Price is back under the pivot point
Type : Bearish
Timeframe : Weekly
Central Patterns, the scanner specializing in chart patterns, did not identify any signals.
No result was found by the Central Candlesticks scanner on Japanese candlesticks.
| S3 | S2 | S1 | Price | R1 | R2 | R3 | |
|---|---|---|---|---|---|---|---|
| ProTrendLines | 7.05 | 8.56 | 8.93 | 9.53 | 9.80 | 11.43 | 11.96 |
| Change (%) | -26.02% | -10.18% | -6.30% | - | +2.83% | +19.94% | +25.50% |
| Change | -2.48 | -0.97 | -0.60 | - | +0.27 | +1.90 | +2.43 |
| Level | Intermediate | Intermediate | Intermediate | - | Intermediate | Minor | Major |
Pivot points can also be used to set your price objectives. Here is the price situation in relation to pivot points:
| Pivot points | S3 | S2 | S1 | PP | R1 | R2 | R3 |
|---|---|---|---|---|---|---|---|
| Standard | 8.70 | 8.85 | 9.15 | 9.30 | 9.60 | 9.75 | 10.05 |
| Camarilla | 9.33 | 9.37 | 9.41 | 9.45 | 9.49 | 9.53 | 9.57 |
| Woodie | 8.78 | 8.89 | 9.23 | 9.34 | 9.68 | 9.79 | 10.13 |
| Fibonacci | 8.85 | 9.02 | 9.13 | 9.30 | 9.47 | 9.58 | 9.75 |
| Pivot points | S3 | S2 | S1 | PP | R1 | R2 | R3 |
|---|---|---|---|---|---|---|---|
| Standard | 8.51 | 8.68 | 8.83 | 9.00 | 9.15 | 9.32 | 9.47 |
| Camarilla | 8.89 | 8.92 | 8.95 | 8.98 | 9.01 | 9.04 | 9.07 |
| Woodie | 8.50 | 8.68 | 8.82 | 9.00 | 9.14 | 9.32 | 9.46 |
| Fibonacci | 8.68 | 8.80 | 8.88 | 9.00 | 9.12 | 9.20 | 9.32 |
| Pivot points | S3 | S2 | S1 | PP | R1 | R2 | R3 |
|---|---|---|---|---|---|---|---|
| Standard | 6.48 | 7.41 | 8.09 | 9.02 | 9.70 | 10.63 | 11.31 |
| Camarilla | 8.33 | 8.48 | 8.62 | 8.77 | 8.92 | 9.07 | 9.21 |
| Woodie | 6.36 | 7.35 | 7.97 | 8.96 | 9.58 | 10.57 | 11.19 |
| Fibonacci | 7.41 | 8.03 | 8.41 | 9.02 | 9.64 | 10.02 | 10.63 |
Numerical data
The following is the status of technical indicators and moving averages registered at the time this technical analysis was created:
| RSI (14): | 65.56 | |
| MACD (12,26,9): | 0.0800 | |
| Directional Movement: | 15.92 | |
| AROON (14): | 71.43 | |
| DEMA (21): | 9.05 | |
| Parabolic SAR (0,02-0,02-0,2): | 8.62 | |
| Elder Ray (13): | 0.49 | |
| Super Trend (3,10): | 8.82 | |
| Zig ZAG (10): | 9.53 | |
| VORTEX (21): | 1.1600 | |
| Stochastique (14,3,5): | 88.23 | |
| TEMA (21): | 9.29 | |
| Williams %R (14): | -8.55 | |
| Chande Momentum Oscillator (20): | 0.89 | |
| Repulse (5,40,3): | 4.2600 | |
| ROCnROLL: | 1 | |
| TRIX (15,9): | -0.0200 | |
| Courbe Coppock: | 9.32 |
| MA7: | 9.14 | |
| MA20: | 8.90 | |
| MA50: | 9.02 | |
| MA100: | 10.27 | |
| MAexp7: | 9.20 | |
| MAexp20: | 9.00 | |
| MAexp50: | 9.21 | |
| MAexp100: | 9.72 | |
| Price / MA7: | +4.27% | |
| Price / MA20: | +7.08% | |
| Price / MA50: | +5.65% | |
| Price / MA100: | -7.21% | |
| Price / MAexp7: | +3.59% | |
| Price / MAexp20: | +5.89% | |
| Price / MAexp50: | +3.47% | |
| Price / MAexp100: | -1.95% |
News
The last news published on OSISKO GOLD ROYALTIES LTD at the time of the generation of this analysis was as follows:
- Osisko Announces Increase to Previously Announced Secondary Offering
- Osisko Announces Share Repurchase and Secondary Offering
- Barksdale Announces C$3.5 Million Strategic Investment by Osisko Gold Royalties
- Osisko Gold Royalties Ltd. Discusses Integration of Recent Acquisitions and Growth Drivers in New SNNLive Video Interview on StockNewsNow.com
- Osisko Gold Royalties Ltd to Host Earnings Call
About author

Online


Add a comment
Comments
0 comments on the analysis OSISKO GOLD ROYALTIES LTD - Daily