BURELLE - Daily - Technical analysis published on 01/23/2020 (GMT)
- Who voted?
- 270
- 0
Click here for a new analysis!
- Timeframe : Daily
- - Analysis generated on
- Status : LEVEL MAINTAINED
Summary of the analysis

Additional analysis
Quotes
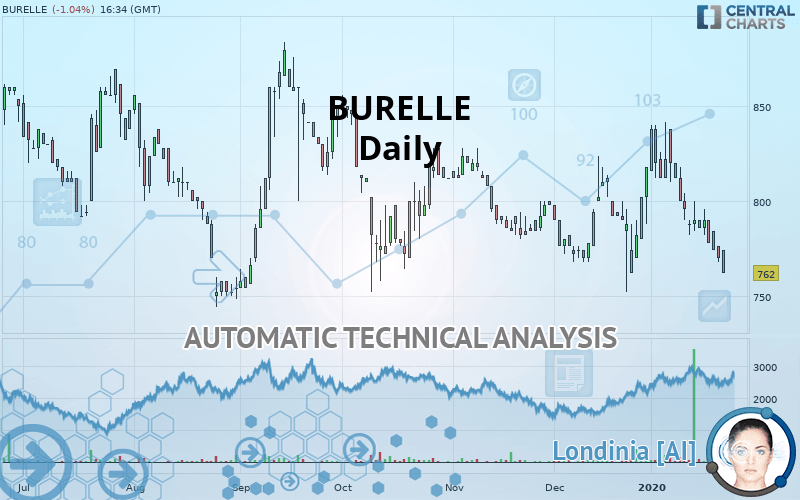
The BURELLE price is 762.0 EUR. The price is lower by -1.04% since the last closing and was between 762.0 EUR and 774.0 EUR. This implies that the price is at 0% from its lowest and at -1.55% from its highest.The Central Gaps scanner detects a bullish opening. A small advantage for buyers in the very short term.
Bullish opening
Type : Bullish
Timeframe : Openning
A study of price movements over other periods shows the following variations:
Abnormal volumes
Timeframe : 20 days
Abnormal volumes
Timeframe : 50 days
Technical
Technical analysis of this Daily chart of BURELLE indicates that the overall trend is bearish. 78.57% of the signals given by moving averages are bearish. This bearish trend is supported by the strong bearish signals given by short-term moving averages. The Central Indicators market scanner currently does not detect any result that concerns moving averages.
In fact, 13 technical indicators on 18 studied are currently positioned bearish. Caution: the Central Indicators scanner currently detects an excess:
CCI indicator is oversold : under -100
Type : Neutral
Timeframe : Daily
Williams %R indicator is oversold : under -80
Type : Neutral
Timeframe : Daily
Pivot points : price is under support 3
Type : Neutral
Timeframe : Daily
Pivot points : price is under support 3
Type : Neutral
Timeframe : Weekly
SuperTrend indicator bearish reversal
Type : Bearish
Timeframe : Daily
Ichimoku - Bearish crossover : Tenkan & Kijun
Type : Bearish
Timeframe : Daily
The Central Patterns scanner, which studies chart patterns, resistances and supports, has identified these signals:
Near support of triangle
Type : Bullish
Timeframe : Daily
Horizontal support is broken
Type : Bearish
Timeframe : Daily
Support of channel is broken
Type : Bearish
Timeframe : Daily
For a small setback in the very short term, the Central Candlesticks scanner currently notes the presence of this bearish pattern in Japanese candlesticks:
Three black crows
Type : Bearish
Timeframe : Daily
| S3 | S2 | S1 | Price | R1 | R2 | R3 | |
|---|---|---|---|---|---|---|---|
| ProTrendLines | 215.9 | 550.0 | 745.6 | 762.0 | 773.0 | 808.2 | 878.8 |
| Change (%) | -71.67% | -27.82% | -2.15% | - | +1.44% | +6.06% | +15.33% |
| Change | -546.1 | -212.0 | -16.4 | - | +11.0 | +46.2 | +116.8 |
| Level | Minor | Minor | Major | - | Intermediate | Intermediate | Major |
Attention could also be paid to pivot points to set price objectives:
| Pivot points | S3 | S2 | S1 | PP | R1 | R2 | R3 |
|---|---|---|---|---|---|---|---|
| Standard | 758.7 | 763.3 | 766.7 | 771.3 | 774.7 | 779.3 | 782.7 |
| Camarilla | 767.8 | 768.5 | 769.3 | 770.0 | 770.7 | 771.5 | 772.2 |
| Woodie | 758.0 | 763.0 | 766.0 | 771.0 | 774.0 | 779.0 | 782.0 |
| Fibonacci | 763.3 | 766.4 | 768.3 | 771.3 | 774.4 | 776.3 | 779.3 |
| Pivot points | S3 | S2 | S1 | PP | R1 | R2 | R3 |
|---|---|---|---|---|---|---|---|
| Standard | 758.0 | 770.0 | 780.0 | 792.0 | 802.0 | 814.0 | 824.0 |
| Camarilla | 784.0 | 786.0 | 788.0 | 790.0 | 792.0 | 794.0 | 796.1 |
| Woodie | 757.0 | 769.5 | 779.0 | 791.5 | 801.0 | 813.5 | 823.0 |
| Fibonacci | 770.0 | 778.4 | 783.6 | 792.0 | 800.4 | 805.6 | 814.0 |
| Pivot points | S3 | S2 | S1 | PP | R1 | R2 | R3 |
|---|---|---|---|---|---|---|---|
| Standard | 700.0 | 726.0 | 772.0 | 798.0 | 844.0 | 870.0 | 916.0 |
| Camarilla | 798.2 | 804.8 | 811.4 | 818.0 | 824.6 | 831.2 | 837.8 |
| Woodie | 710.0 | 731.0 | 782.0 | 803.0 | 854.0 | 875.0 | 926.0 |
| Fibonacci | 726.0 | 753.5 | 770.5 | 798.0 | 825.5 | 842.5 | 870.0 |
Numerical data
The following is the status of technical indicators and moving averages registered at the time this technical analysis was created:
| RSI (14): | 34.90 | |
| MACD (12,26,9): | -6.9000 | |
| Directional Movement: | -4.4 | |
| AROON (14): | -85.7 | |
| DEMA (21): | 782.7 | |
| Parabolic SAR (0,02-0,02-0,2): | 833.8 | |
| Elder Ray (13): | -17.1 | |
| Super Trend (3,10): | 811.4 | |
| Zig ZAG (10): | 762.0 | |
| VORTEX (21): | 0.9000 | |
| Stochastique (14,3,5): | 0.90 | |
| TEMA (21): | 775.8 | |
| Williams %R (14): | -100.00 | |
| Chande Momentum Oscillator (20): | -60.0 | |
| Repulse (5,40,3): | -4.2000 | |
| ROCnROLL: | 2 | |
| TRIX (15,9): | 0.0000 | |
| Courbe Coppock: | 8.10 |
| MA7: | 778.6 | |
| MA20: | 796.7 | |
| MA50: | 792.0 | |
| MA100: | 804.6 | |
| MAexp7: | 777.1 | |
| MAexp20: | 789.3 | |
| MAexp50: | 794.9 | |
| MAexp100: | 803.6 | |
| Price / MA7: | -2.13% | |
| Price / MA20: | -4.36% | |
| Price / MA50: | -3.79% | |
| Price / MA100: | -5.29% | |
| Price / MAexp7: | -1.94% | |
| Price / MAexp20: | -3.46% | |
| Price / MAexp50: | -4.14% | |
| Price / MAexp100: | -5.18% |
News
The latest news and videos published on BURELLE at the time of the analysis were as follows:
 Burelle
About author

Online


Add a comment
Comments
0 comments on the analysis BURELLE - Daily