Technical analyses - Commodities - English - without AI analysis

You are currently viewing all technical analyses in Commodities market in English without AI analysis regarding all markets, sorted by Latest comments.


GOLD - USD > Analyses
SBernukhov_Exness
SBernukhov_Exness has published a new analysis.
  • 0
  • 2
  • 2
  • 0
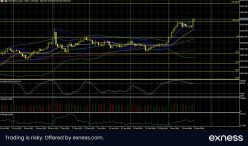
GOLD - USD - 30 min.

Timeframe : 30 min. - Simple chart

Gold is displaying weakness after a failure of buyers to break 2172. After the publication of a strong PPI report for the United States, it's becoming clear that inflation persists and the interest…
Chart
WTI CRUDE OIL > Analyses
antreas_exness
antreas_exness has published a new analysis.
  • 0
  • 2
  • 3
  • 0
WTI CRUDE OIL - Daily

Timeframe : Daily - Simple chart

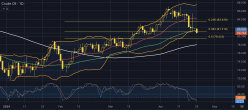
WTI crude futures dropped to around $77 per barrel for the third consecutive session amid cautious investor sentiment ahead of key US inflation data and OPEC and the International Energy Agency…
Chart
GOLD - USD > Analyses
kogajakarta has published a new analysis.
  • 3
  • 42
  • 36
  • 18
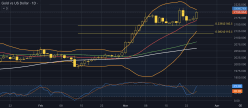
GOLD - USD - 4H

Timeframe : 4H - Chart + Price target(s)

Chart
GOLD - USD > Analyses
Michael_Stark_Exness
Michael_Stark_Exness has published a new analysis.
  • 0
  • 3
  • 4
  • 0
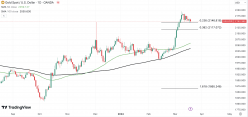
GOLD - USD - Daily

Timeframe : Daily - Simple chart

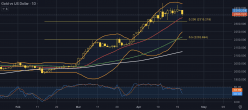
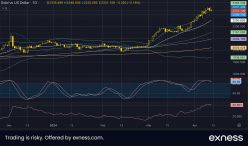
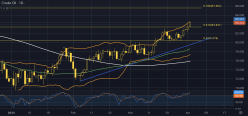
In the aftermath of the latest NFP, the US dollar has declined across the board while gold’s recent strong gains have continued to end the week close to its all-time high of about $2,185. Signs that…
Chart
GOLD - USD > Analyses
Exness
Exness has published a new analysis.
  • 16
  • 343
  • 52
  • 0
GOLD - USD - Daily

Timeframe : Daily - Simple chart

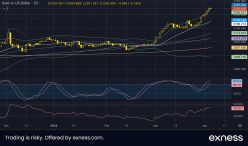
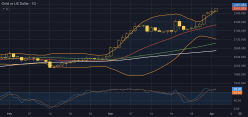
The gold price is currently near a two-month high due to subdued USD demand, a softer risk tone, and upcoming US data/events that could provide a fresh boost. The recent disappointing US macro…
Chart
WTI CRUDE OIL > Analyses
Exness
Exness has published a new analysis.
  • 16
  • 343
  • 52
  • 0
WTI CRUDE OIL - Daily

Timeframe : Daily - Simple chart

OPEC+ extended production cuts, signaling a response to lower demand and increased output from other producers. The slow but steady rise in oil prices this year has been influenced by tightening…
Chart
GOLD - USD > Analyses
Exness
Exness has published a new analysis.
  • 16
  • 343
  • 52
  • 0
GOLD - USD - Daily

Timeframe : Daily - Simple chart

The last week of February was notable due to the publication of the PCE index, known as a “FED’s inflation”. It had displayed a new peak for the 6 months, justifying a restrictive monetary…
Chart
GOLD - USD > Analyses
Exness
Exness has published a new analysis.
  • 16
  • 343
  • 52
  • 0
GOLD - USD - Daily

Timeframe : Daily - Simple chart

Gold prices remained within a tight trading range between $2,025 - $2,035 amid concerns of higher-for-longer U.S. rates, driven by signs of sticky U.S. inflation and resilience in the job market which…
Chart
WTI CRUDE OIL > Analyses
Exness
Exness has published a new analysis.
  • 16
  • 343
  • 52
  • 0
WTI CRUDE OIL - Daily

Timeframe : Daily - Simple chart

Chart
GOLD - USD > Analyses
kogajakarta has published a new analysis.
  • 3
  • 42
  • 36
  • 18
GOLD - USD - 4H

Timeframe : 4H - Chart + Trading signal

p;lease comment my prediction
Chart
GOLD - USD > Analyses
Exness
Exness has published a new analysis.
  • 16
  • 343
  • 52
  • 0
GOLD - USD - Daily

Timeframe : Daily - Simple chart

Gold has recovered steadily since the significant drop around inflation on 13 February. Now that the price is within the value area between the 50 and 100 SMAs, it might consolidate for a while before…
Chart
GOLD - USD > Analyses
kogajakarta has published a new analysis.
  • 3
  • 42
  • 36
  • 18
GOLD - USD - Daily

Timeframe : Daily - Chart + Trading signal

Chart
PLATINUM > Analyses
elliottwaveforecast has published a new analysis.
  • 8
  • 430
  • 273
  • 0
PLATINUM - Daily

Timeframe : Daily - Simple chart

Chart
GOLD - USD > Analyses
kogajakarta has published a new analysis.
  • 3
  • 42
  • 36
  • 18
GOLD - USD - 4H

Timeframe : 4H - Chart + Trading signal

XAUUSD  SELLS TOP AT PRICE 2021 TP 2008 
Chart
GOLD - USD > Analyses
Exness
Exness has published a new analysis.
  • 16
  • 343
  • 52
  • 0
GOLD - USD - Daily

Timeframe : Daily - Simple chart

Gold prices continue to rise after testing the support of the $2,000 level after some strong economic data from the United States last week. More specifically inflation in the USA proved to be…
Chart
GOLD - USD > Analyses
kogajakarta has published a new analysis.
  • 3
  • 42
  • 36
  • 18
GOLD - USD - 4H

Timeframe : 4H - Simple chart

Chart
NATURAL GAS > Analyses
Exness
Exness has published a new analysis.
  • 16
  • 343
  • 52
  • 0
NATURAL GAS - Daily

Timeframe : Daily - Simple chart

Natural gas is bottoming after a sharp drop. It’s important to mention that trying to pick the bottom might be an incredibly difficult and dangerous strategy. The bullish reversal may be sharp and…
Chart
WTI CRUDE OIL > Analyses
Exness
Exness has published a new analysis.
  • 16
  • 343
  • 52
  • 0
WTI CRUDE OIL - Daily

Timeframe : Daily - Simple chart

Crude oil is consolidating at around the $77 level, and should it break above the border of the chart formation displayed on the chart, it may drive higher toward the $79-80 price area. The net…
Chart
GOLD - USD > Analyses
mani1193 has published a new analysis.
  • 1
  • 5
  • 1
  • 0
GOLD - USD - 1H

Timeframe : 1H - Simple chart

Chart
GOLD - USD > Analyses
Exness
Exness has published a new analysis.
  • 16
  • 343
  • 52
  • 0
GOLD - USD - Daily

Timeframe : Daily - Simple chart

Chart