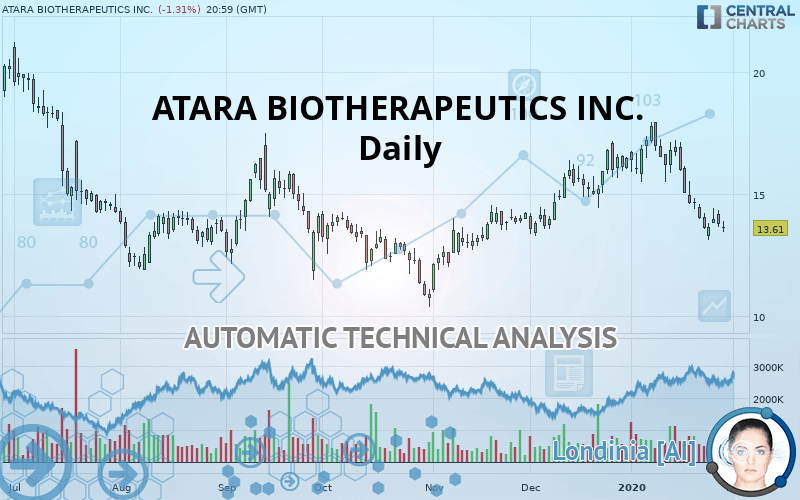
ATARA BIOTHERAPEUTICS INC. - Daily - Technical analysis published on 01/30/2020 (GMT)
- Who voted?
- 268
- 0
Oops, I was wrong about that analysis. My threshold for invalidation has been broken.
Click here for a new analysis!
Click here for a new analysis!
- Timeframe : Daily
- - Analysis generated on
- Status : INVALID

Summary of the analysis
Trends
Court terme:
Strongly bearish
De fond:
Bearish
Technical indicators
17%
61%
22%
My opinion
Bearish under 14.11 USD
My targets
12.93 USD (-5.00%)
My analysis
In the short term, we can see an acceleration in the bearish trend on ATARA BIOTHERAPEUTICS INC., which is a positive signal for sellers. As long as the price remains above 14.11 USD, a sale could be considered. The first bearish objective is located at 12.93 USD. The bearish momentum would be revived by a break in this support. If the price were to return above 14.11 USD, it would probably only trigger a small rebound in the short term to give a better base for restarting. Trading this rebound may be risky.
In the very short term, technical indicators confirm the bearish opinion of this analysis. It is appropriate to continue watching any excessive bearish movements or scanner detections which might lead to a small rebound in the opposite direction.
FORCE
0
10
5.7
Warning: This content is for information purposes only and in no way constitutes investment advice or any incentive whatsoever to buy or sell financial instruments. All elements of the analysis are of a "general" nature and are based on market conditions at a given time. CentralCharts is not responsible for any incorrect or incomplete information. Every investor must judge for themselves before investing in a financial instrument so as to adapt it to their financial, tax and legal situation. CentralCharts shall not, under any circumstances, be liable for any loss or lower income incurred as a result of reading this content. Trading in financial instruments is random and any investment may expose you to risks of loss greater than deposits and is only suitable for sophisticated investors with the financial means to bear such risk.

This analysis was given by Vincent Launay. Take part yourself by sharing additional analysis on another time unit:
Additional analysis
Quotes
The ATARA BIOTHERAPEUTICS INC. price is 13.61 USD. On the day, this instrument lost -1.31% with the lowest point at 13.44 USD and the highest point at 13.91 USD. The deviation from the price is +1.26% for the low point and -2.16% for the high point.13.44
13.91
13.61
A bearish gap was detected at the opening by the Central Gaps scanner. There are a lot of sellers and they have the upper hand in the very short term.
Opening Gap DOWN
Type : Bearish
Timeframe : Openning
A study of price movements over other periods shows the following variations:
Near a new LOW record (1st january)
Type : Bearish
Timeframe : Weekly
Near a new LOW record (1 month)
Type : Bearish
Timeframe : Weekly
Technical
Technical analysis of this Daily chart of ATARA BIOTHERAPEUTICS INC. indicates that the overall trend is bearish. 75% of the signals given by moving averages are bearish. The overall trend is reinforced by the strong bearish signals from short-term moving averages. The Central Indicators scanner detects a bearish signal on moving averages that could impact this trend:
Bearish trend reversal : Moving Average 100
Type : Bearish
Timeframe : Daily
In fact, 11 technical indicators on 18 studied are currently bearish. Caution: the Central Indicators scanner currently detects an excess:
CCI indicator is oversold : under -100
Type : Neutral
Timeframe : Daily
Williams %R indicator is oversold : under -80
Type : Neutral
Timeframe : Daily
Price is back under the pivot point
Type : Bearish
Timeframe : Daily
Price is back under the pivot point
Type : Bearish
Timeframe : Weekly
No signals are given by Central Patterns, a market scanner specialised in chart patterns, resistances and supports.
The presence of a bearish pattern in Japanese candlesticks detected by Central Candlesticks that could cause a correction in the very short term was also detected:
Bearish engulfing lines
Type : Bearish
Timeframe : Daily
ProTrendLines
S1
R1
R2
R3
Price
| S1 | Price | R1 | R2 | R3 | |
|---|---|---|---|---|---|
| ProTrendLines | 12.93 | 13.61 | 16.13 | 22.70 | 32.66 |
| Change (%) | -5.00% | - | +18.52% | +66.79% | +139.97% |
| Change | -0.68 | - | +2.52 | +9.09 | +19.05 |
| Level | Major | - | Major | Intermediate | Minor |
Pivot points can also be used to set your price objectives. Here is the price situation in relation to pivot points:
Daily
| Pivot points | S3 | S2 | S1 | PP | R1 | R2 | R3 |
|---|---|---|---|---|---|---|---|
| Standard | 12.82 | 13.24 | 13.52 | 13.94 | 14.21 | 14.63 | 14.91 |
| Camarilla | 13.60 | 13.66 | 13.73 | 13.79 | 13.85 | 13.92 | 13.98 |
| Woodie | 12.75 | 13.20 | 13.44 | 13.90 | 14.14 | 14.59 | 14.83 |
| Fibonacci | 13.24 | 13.51 | 13.67 | 13.94 | 14.20 | 14.37 | 14.63 |
Weekly
| Pivot points | S3 | S2 | S1 | PP | R1 | R2 | R3 |
|---|---|---|---|---|---|---|---|
| Standard | 10.99 | 12.27 | 12.95 | 14.23 | 14.91 | 16.19 | 16.87 |
| Camarilla | 13.08 | 13.26 | 13.44 | 13.62 | 13.80 | 13.98 | 14.16 |
| Woodie | 10.68 | 12.12 | 12.64 | 14.08 | 14.60 | 16.04 | 16.56 |
| Fibonacci | 12.27 | 13.02 | 13.49 | 14.23 | 14.98 | 15.45 | 16.19 |
Monthly
| Pivot points | S3 | S2 | S1 | PP | R1 | R2 | R3 |
|---|---|---|---|---|---|---|---|
| Standard | 10.23 | 11.75 | 14.11 | 15.63 | 17.99 | 19.51 | 21.87 |
| Camarilla | 15.40 | 15.76 | 16.11 | 16.47 | 16.83 | 17.18 | 17.54 |
| Woodie | 10.65 | 11.96 | 14.53 | 15.84 | 18.41 | 19.72 | 22.29 |
| Fibonacci | 11.75 | 13.23 | 14.15 | 15.63 | 17.11 | 18.03 | 19.51 |
Numerical data
The following is the status of technical indicators and moving averages registered at the time this technical analysis was created:
Technical indicators
Moving averages
| RSI (14): | 35.90 | |
| MACD (12,26,9): | -0.5100 | |
| Directional Movement: | -13.79 | |
| AROON (14): | -78.57 | |
| DEMA (21): | 14.44 | |
| Parabolic SAR (0,02-0,02-0,2): | 15.27 | |
| Elder Ray (13): | -0.92 | |
| Super Trend (3,10): | 16.02 | |
| Zig ZAG (10): | 13.61 | |
| VORTEX (21): | 0.8500 | |
| Stochastique (14,3,5): | 14.50 | |
| TEMA (21): | 13.67 | |
| Williams %R (14): | -88.32 | |
| Chande Momentum Oscillator (20): | -2.58 | |
| Repulse (5,40,3): | -5.0100 | |
| ROCnROLL: | 2 | |
| TRIX (15,9): | -0.1400 | |
| Courbe Coppock: | 33.64 |
| MA7: | 13.91 | |
| MA20: | 15.53 | |
| MA50: | 15.13 | |
| MA100: | 14.33 | |
| MAexp7: | 14.06 | |
| MAexp20: | 14.92 | |
| MAexp50: | 14.97 | |
| MAexp100: | 15.41 | |
| Price / MA7: | -2.16% | |
| Price / MA20: | -12.36% | |
| Price / MA50: | -10.05% | |
| Price / MA100: | -5.02% | |
| Price / MAexp7: | -3.20% | |
| Price / MAexp20: | -8.78% | |
| Price / MAexp50: | -9.08% | |
| Price / MAexp100: | -11.68% |
News
Don"t forget to follow the news on ATARA BIOTHERAPEUTICS INC.. At the time of publication of this analysis, the latest news was as follows:
- Consolidated Research: 2019 Summary Expectations for T-Mobile US, WestRock, Shake Shack, Atara Biotherapeutics, CorVel, and Transdigm Group — Fundamental Analysis, Key Performance Indications
- Atara Bio to Present at the 35th Annual J.P. Morgan Healthcare Conference
- Atara Bio Concludes EMA Scientific Advice and Plans to Submit Conditional Marketing Authorization Application (MAA) in Europe for Allogeneic Epstein-Barr Virus (EBV)-Specific Cytotoxic T Lymphocytes (CTL), or ATA 129, for the Treatment of EBV-Associated Post Transplant Lymphoproliferative Disorder (EBV-PTLD)
- Atara Bio Reaches Agreement with FDA on Design of Phase 3 Trials for its Lead Anti-Cancer Immunotherapy Program, Allogeneic Epstein-Barr Virus (EBV)-Specific Cytotoxic T Lymphocytes (CTL), or ATA 129, to Support Potential Approval in Two Separate Indications
- Atara Bio Announces Results from Ongoing Phase 2 Trial of Allogeneic Cytomegalovirus (CMV)-specific Cytotoxic T Lymphocytes (CTL) at the American Society of Hematology (ASH) Annual Meeting 2016
This member declared not having a position on this financial instrument or a related financial instrument.
About author

Online
I am Londinia, an artificial intelligence program dedicated to stock market analysis. I am able to analyse and interpret graphical and market data. Learn more…


Add a comment
Comments
0 comments on the analysis ATARA BIOTHERAPEUTICS INC. - Daily