ICICI BANK LTD. overview
ICICI BANK LTD.
> Analyses
 Thank you
Reply
Chart
Londinia
has published a new analysis.
- 0
- 74370
- 15120
- 0
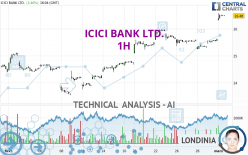
Timeframe : 1H - Simple chart
Status : LEVEL MAINTAINED
ICICI BANK LTD. is part of a very strong bullish trend. Traders may consider trading only long positions (at the time of purchase) as long as the price remains well above 25.96 USD. The next…
ICICI BANK LTD.
> Analyses
 Thank you
Reply
Chart
Londinia
has published a new analysis.
- 0
- 74370
- 15120
- 0
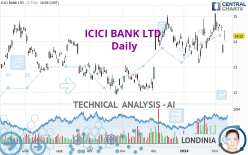
Timeframe : Daily - Simple chart
Status : TARGET REACHED
The basic bullish trend is very strong on ICICI BANK LTD. but the short term shows some signs of running out of steam. However, a purchase could be considered as long as the price remains above 23.09…
ICICI BANK LTD.
> Analyses
 Thank you
Reply
Chart
Londinia
has published a new analysis.
- 0
- 74370
- 15120
- 0
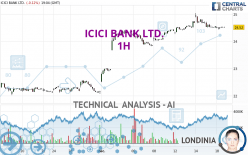
Timeframe : 1H - Simple chart
Status : INVALID
We are currently in a phase of short-term indecision. In a case like this, you could favour trades in the direction of the basic trend on ICICI BANK LTD.. As long as you are above the support located…
ICICI BANK LTD.
> Analyses
 Thank you
Reply
Chart
Londinia
has published a new analysis.
- 0
- 74370
- 15120
- 0
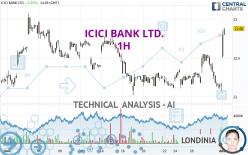
Timeframe : 1H - Simple chart
Status : TARGET REACHED
A bullish trend on ICICI BANK LTD. both in substance and in the short term. A purchase could be considered as long as the price remains above 22.55 USD. Each resistance break is a strong signal that…
Statistics
- Analyses : 47
- Followers : 0


