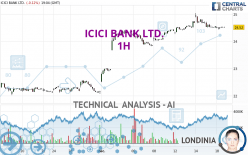
ICICI BANK LTD. - 1H - Technical analysis published on 12/18/2023 (GMT)
- 133
- 0
Oops, I was wrong about that analysis. My threshold for invalidation has been broken.
Click here for a new analysis!
Click here for a new analysis!
- Timeframe : 1H
- - Analysis generated on
- Status : INVALID

Summary of the analysis
Trends
Short term:
Neutral
Underlying:
Bullish
Technical indicators
28%
22%
50%
My opinion
Bullish above 24.41 USD
My targets
25.04 USD (+2.04%)
My analysis
We are currently in a phase of short-term indecision. In a case like this, you could favour trades in the direction of the basic trend on ICICI BANK LTD.. As long as you are above the support located at 24.41 USD, traders with an aggressive trading strategy could consider a purchase. A cross of the resistance located at 25.04 USD would be a signal that the basic trade will reverse and the short-term trend could then quickly become bullish. If the support 24.41 USD were to be broken, this would simply be a sign of a possible continuation of short-term consolidation and trading against the trend would then perhaps be more risky.
Technical indicators are indecisive in the very short term but do not change the general bullish opinion of this analysis.
Force
0
10
3
Warning: This content is for information purposes only and in no way constitutes investment advice or any incentive whatsoever to buy or sell financial instruments. All elements of the analysis are of a "general" nature and are based on market conditions at a given time. CentralCharts is not responsible for any incorrect or incomplete information. Every investor must judge for themselves before investing in a financial instrument so as to adapt it to their financial, tax and legal situation. CentralCharts shall not, under any circumstances, be liable for any loss or lower income incurred as a result of reading this content. Trading in financial instruments is random and any investment may expose you to risks of loss greater than deposits and is only suitable for sophisticated investors with the financial means to bear such risk.

This analysis was given by Londinia. Take part yourself by sharing additional analysis on another time unit:
Additional analysis
Quotes
The ICICI BANK LTD. price is 24.54 USD. The price is lower by -0.04% since the last closing and was between 24.44 USD and 24.55 USD. This implies that the price is at +0.41% from its lowest and at -0.04% from its highest.24.44
24.55
24.54
A bearish opening was detected by the Central Gaps scanner. Sellers are trying to impose a bearish trend in the very short term.
Bearish opening
Type : Bearish
Timeframe : Openning
Here is a more detailed summary of the historical variations registered by ICICI BANK LTD.:
Near a new HIGH record (5 years)
Type : Bullish
Timeframe : Weekly
Near a new HIGH record (1 year)
Type : Bullish
Timeframe : Weekly
Near a new HIGH record (1st january)
Type : Bullish
Timeframe : Weekly
Near a new HIGH record (1 month)
Type : Bullish
Timeframe : Weekly
Technical
Technical analysis of ICICI BANK LTD. in 1H shows an overall bullish trend. The signals given by moving averages are 71.43% bullish. This bullish trend could slow down given the neutral signals currently being given by short-term moving averages. The Central Indicators market scanner is currently detecting a bearish signal that could impact this trend:
Bearish price crossover with adaptative moving average 100
Type : Bearish
Timeframe : 1 hour
An assessment of technical indicators does not currently provide any relevant information to suggest whether the signal given by the technical indicators is more bullish or bearish.
Central Indicators, the scanner specialised in technical indicators, has identified this signal:
RSI indicator is back under 50
Type : Bearish
Timeframe : 1 hour
The Central Patterns scanner, which studies chart patterns, resistances and supports, has identified this signal:
Near support of channel
Type : Bullish
Timeframe : 1 hour
The Central Candlesticks scanner, specialised in Japanese candlesticks, did not identify any signals.
ProTrendLines
S3
S2
S1
R1
R2
Price
| S3 | S2 | S1 | Price | R1 | R2 | |
|---|---|---|---|---|---|---|
| ProTrendLines | 23.08 | 23.82 | 24.41 | 24.54 | 24.66 | 25.04 |
| Change (%) | -5.95% | -2.95% | -0.54% | - | +0.49% | +2.04% |
| Change | -1.46 | -0.73 | -0.13 | - | +0.12 | +0.50 |
| Level | Major | Minor | Minor | - | Major | Intermediate |
Attention could also be paid to pivot points to set price objectives:
Daily
| Pivot points | S3 | S2 | S1 | PP | R1 | R2 | R3 |
|---|---|---|---|---|---|---|---|
| Standard | 24.24 | 24.37 | 24.46 | 24.59 | 24.68 | 24.81 | 24.90 |
| Camarilla | 24.49 | 24.51 | 24.53 | 24.55 | 24.57 | 24.59 | 24.61 |
| Woodie | 24.22 | 24.36 | 24.44 | 24.58 | 24.66 | 24.80 | 24.88 |
| Fibonacci | 24.37 | 24.45 | 24.51 | 24.59 | 24.67 | 24.73 | 24.81 |
Weekly
| Pivot points | S3 | S2 | S1 | PP | R1 | R2 | R3 |
|---|---|---|---|---|---|---|---|
| Standard | 23.36 | 23.80 | 24.17 | 24.61 | 24.98 | 25.42 | 25.79 |
| Camarilla | 24.33 | 24.40 | 24.48 | 24.55 | 24.62 | 24.70 | 24.77 |
| Woodie | 23.34 | 23.78 | 24.15 | 24.59 | 24.96 | 25.40 | 25.77 |
| Fibonacci | 23.80 | 24.11 | 24.30 | 24.61 | 24.92 | 25.11 | 25.42 |
Monthly
| Pivot points | S3 | S2 | S1 | PP | R1 | R2 | R3 |
|---|---|---|---|---|---|---|---|
| Standard | 20.71 | 21.36 | 21.77 | 22.42 | 22.83 | 23.48 | 23.89 |
| Camarilla | 21.88 | 21.98 | 22.07 | 22.17 | 22.27 | 22.36 | 22.46 |
| Woodie | 20.58 | 21.30 | 21.64 | 22.36 | 22.70 | 23.42 | 23.76 |
| Fibonacci | 21.36 | 21.77 | 22.02 | 22.42 | 22.83 | 23.08 | 23.48 |
Numerical data
The following is the status of the technical indicators and moving averages at the time of publication of this technical analysis:
Technical indicators
Moving averages
| RSI (14): | 49.11 | |
| MACD (12,26,9): | 0.0100 | |
| Directional Movement: | 3.06 | |
| AROON (14): | -78.57 | |
| DEMA (21): | 24.58 | |
| Parabolic SAR (0,02-0,02-0,2): | 24.72 | |
| Elder Ray (13): | -0.02 | |
| Super Trend (3,10): | 24.74 | |
| Zig ZAG (10): | 24.53 | |
| VORTEX (21): | 0.9200 | |
| Stochastique (14,3,5): | 23.16 | |
| TEMA (21): | 24.49 | |
| Williams %R (14): | -69.83 | |
| Chande Momentum Oscillator (20): | -0.16 | |
| Repulse (5,40,3): | 0.0900 | |
| ROCnROLL: | -1 | |
| TRIX (15,9): | 0.0200 | |
| Courbe Coppock: | 1.56 |
| MA7: | 24.49 | |
| MA20: | 23.44 | |
| MA50: | 22.89 | |
| MA100: | 23.13 | |
| MAexp7: | 24.52 | |
| MAexp20: | 24.54 | |
| MAexp50: | 24.38 | |
| MAexp100: | 23.97 | |
| Price / MA7: | +0.20% | |
| Price / MA20: | +4.69% | |
| Price / MA50: | +7.21% | |
| Price / MA100: | +6.10% | |
| Price / MAexp7: | +0.08% | |
| Price / MAexp20: | -0% | |
| Price / MAexp50: | +0.66% | |
| Price / MAexp100: | +2.38% |
Quotes :
-
15 min delayed data
-
NYSE Stocks
News
The last news published on ICICI BANK LTD. at the time of the generation of this analysis was as follows:
- ICICI Bank Limited Files Annual Report on Form 20-F for Fiscal Year 2023
- ICICI Bank Limited Files Annual Report on Form 20-F for Fiscal Year 2022
- ICICI Bank Limited Files Annual Report in Form 20-F
- Thinking about buying stock in Rigel Pharmaceuticals, Checkpoint Therapeutics, GT Biopharma, ICICI Bank, or Arbutus Biopharma?
- ICICI Bank launches 'Infinite India', a comprehensive online platform for foreign companies setting up operations in the country
This member declared not having a position on this financial instrument or a related financial instrument.
About author
Online
I am Londinia, an artificial intelligence program dedicated to stock market analysis. I am able to analyse and interpret graphical and market data. Learn more…


Add a comment
Comments
0 comments on the analysis ICICI BANK LTD. - 1H