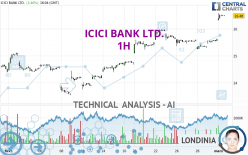
ICICI BANK LTD. - 1H - Technical analysis published on 03/01/2024 (GMT)
- 108
- 0
Click here for a new analysis!
- Timeframe : 1H
- - Analysis generated on
- Status : LEVEL MAINTAINED

Summary of the analysis

Additional analysis
Quotes
The ICICI BANK LTD. rating is 26.49 USD. On the day, this instrument gained +3.44% and was traded between 26.31 USD and 26.58 USD over the period. The price is currently at +0.68% from its lowest and -0.34% from its highest.A bullish gap was detected at the opening by the Central Gaps scanner. There are a lot of buyers and they have the upper hand in the very short term.
Opening Gap UP
Type : Bullish
Timeframe : Openning
Here is a more detailed summary of the historical variations registered by ICICI BANK LTD.:
New HIGH record (5 years)
Type : Bullish
Timeframe : Weekly
New HIGH record (1 year)
Type : Bullish
Timeframe : Weekly
New HIGH record (1st january)
Type : Bullish
Timeframe : Weekly
New HIGH record (1 month)
Type : Bullish
Timeframe : Weekly
Technical
A technical analysis in 1H of this ICICI BANK LTD. chart shows a strongly bullish trend. 92.86% of the signals given by moving averages are bullish. This strongly bullish trend is supported by the strong bullish signals given by short-term moving averages. The Central Indicators scanner detects a bullish signal on moving averages that could impact this trend:
Moving Average bullish crossovers : MA20 & MA50
Type : Bullish
Timeframe : 1 hour
The probability of a further increase is high given the direction of the technical indicators.
Caution: the Central Indicators scanner currently detects an excess:
RSI indicator is overbought : over 80
Type : Neutral
Timeframe : 1 hour
CCI indicator is overbought : over 100
Type : Neutral
Timeframe : 1 hour
Williams %R indicator is overbought : over -20
Type : Neutral
Timeframe : 1 hour
Pivot points : price is over resistance 2
Type : Neutral
Timeframe : Weekly
Pivot points : price is over resistance 3
Type : Neutral
Timeframe : 1 hour
An analysis of the price chart with the Central Patterns scanner (detector of chart patterns and resistances and supports) shows a result that can have an impact on the price change:
Resistance of channel is broken
Type : Bullish
Timeframe : 1 hour
The presence of these Japanese chandelier patterns detected by Central Candlesticks that could impact the current short-term trend were also noted:
Bullish harami
Type : Bullish
Timeframe : 1 hour
Doji
Type : Neutral
Timeframe : 1 hour
| S3 | S2 | S1 | Price | |
|---|---|---|---|---|
| ProTrendLines | 25.24 | 25.60 | 25.96 | 26.49 |
| Change (%) | -4.72% | -3.36% | -2.00% | - |
| Change | -1.25 | -0.89 | -0.53 | - |
| Level | Intermediate | Intermediate | Major | - |
Pivot points can also be used to set your price objectives. Here is the price situation in relation to pivot points:
| Pivot points | S3 | S2 | S1 | PP | R1 | R2 | R3 |
|---|---|---|---|---|---|---|---|
| Standard | 25.32 | 25.38 | 25.50 | 25.56 | 25.68 | 25.74 | 25.86 |
| Camarilla | 25.56 | 25.58 | 25.59 | 25.61 | 25.63 | 25.64 | 25.66 |
| Woodie | 25.34 | 25.40 | 25.52 | 25.58 | 25.70 | 25.76 | 25.88 |
| Fibonacci | 25.38 | 25.45 | 25.50 | 25.56 | 25.63 | 25.68 | 25.74 |
| Pivot points | S3 | S2 | S1 | PP | R1 | R2 | R3 |
|---|---|---|---|---|---|---|---|
| Standard | 24.25 | 24.66 | 25.15 | 25.56 | 26.05 | 26.46 | 26.95 |
| Camarilla | 25.38 | 25.47 | 25.55 | 25.63 | 25.71 | 25.80 | 25.88 |
| Woodie | 24.28 | 24.68 | 25.18 | 25.58 | 26.08 | 26.48 | 26.98 |
| Fibonacci | 24.66 | 25.01 | 25.22 | 25.56 | 25.91 | 26.12 | 26.46 |
| Pivot points | S3 | S2 | S1 | PP | R1 | R2 | R3 |
|---|---|---|---|---|---|---|---|
| Standard | 21.67 | 22.60 | 24.11 | 25.04 | 26.55 | 27.48 | 28.99 |
| Camarilla | 24.94 | 25.16 | 25.39 | 25.61 | 25.83 | 26.06 | 26.28 |
| Woodie | 21.95 | 22.75 | 24.39 | 25.19 | 26.83 | 27.63 | 29.27 |
| Fibonacci | 22.60 | 23.54 | 24.11 | 25.04 | 25.98 | 26.55 | 27.48 |
Numerical data
The following are the details of the technical indicators and moving averages that were collected to generate this technical analysis:
| RSI (14): | 83.19 | |
| MACD (12,26,9): | 0.2200 | |
| Directional Movement: | 41.66 | |
| AROON (14): | 57.14 | |
| DEMA (21): | 26.06 | |
| Parabolic SAR (0,02-0,02-0,2): | 25.59 | |
| Elder Ray (13): | 0.54 | |
| Super Trend (3,10): | 26.05 | |
| Zig ZAG (10): | 26.49 | |
| VORTEX (21): | 1.1100 | |
| Stochastique (14,3,5): | 93.02 | |
| TEMA (21): | 26.23 | |
| Williams %R (14): | -6.97 | |
| Chande Momentum Oscillator (20): | 1.16 | |
| Repulse (5,40,3): | 0.2000 | |
| ROCnROLL: | 1 | |
| TRIX (15,9): | 0.0400 | |
| Courbe Coppock: | 5.81 |
| MA7: | 25.73 | |
| MA20: | 24.97 | |
| MA50: | 24.38 | |
| MA100: | 23.64 | |
| MAexp7: | 26.18 | |
| MAexp20: | 25.82 | |
| MAexp50: | 25.57 | |
| MAexp100: | 25.26 | |
| Price / MA7: | +2.95% | |
| Price / MA20: | +6.09% | |
| Price / MA50: | +8.65% | |
| Price / MA100: | +12.06% | |
| Price / MAexp7: | +1.18% | |
| Price / MAexp20: | +2.59% | |
| Price / MAexp50: | +3.60% | |
| Price / MAexp100: | +4.87% |
News
The last news published on ICICI BANK LTD. at the time of the generation of this analysis was as follows:
- ICICI Bank Limited Files Annual Report on Form 20-F for Fiscal Year 2023
- ICICI Bank Limited Files Annual Report on Form 20-F for Fiscal Year 2022
- ICICI Bank Limited Files Annual Report in Form 20-F
- Thinking about buying stock in Rigel Pharmaceuticals, Checkpoint Therapeutics, GT Biopharma, ICICI Bank, or Arbutus Biopharma?
- ICICI Bank launches 'Infinite India', a comprehensive online platform for foreign companies setting up operations in the country
About author
Online


Add a comment
Comments
0 comments on the analysis ICICI BANK LTD. - 1H