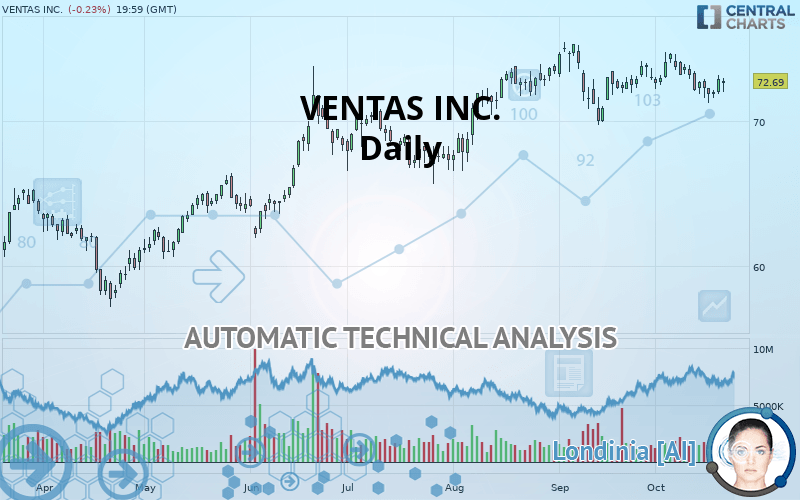
VENTAS INC. - Daily - Technical analysis published on 10/22/2019 (GMT)
- Who voted?
- 230
- 0
Click here for a new analysis!
- Timeframe : Daily
- - Analysis generated on
- Status : INVALID

Summary of the analysis

Additional analysis
Quotes
The VENTAS INC. rating is 72.69 USD. The price is lower by -0.23% since the last closing and was traded between 71.97 USD and 72.91 USD over the period. The price is currently at +1.00% from its lowest and -0.30% from its highest.A bearish opening was detected by the Central Gaps scanner. Sellers are trying to impose a bearish trend in the very short term.
Bearish opening
Type : Bearish
Timeframe : Openning
So that you have an overall view of the price change, here is a table showing the variations over several periods:
Near a new HIGH record (5 years)
Type : Bullish
Timeframe : Weekly
Near a new HIGH record (1 year)
Type : Bullish
Timeframe : Weekly
Near a new HIGH record (1st january)
Type : Bullish
Timeframe : Weekly
Technical
A technical analysis in Daily of this VENTAS INC. chart shows a strongly bullish trend. 85.71% of the signals given by moving averages are bullish. The slightly bullish signals given by the short-term moving averages show a weakening of the global trend. The Central Indicators market scanner is currently detecting several bullish signals that could impact this trend:
Bullish trend reversal : adaptative moving average 20
Type : Bullish
Timeframe : Daily
Bullish price crossover with Moving Average 20
Type : Bullish
Timeframe : Daily
Bullish price crossover with Moving Average 50
Type : Bullish
Timeframe : Daily
Bullish price crossover with adaptative moving average 20
Type : Bullish
Timeframe : Daily
An assessment of technical indicators does not currently provide any relevant information on the direction of future price movements.
Central Indicators, the detector scanner for these technical indicators has recently detected several signals:
RSI indicator is back over 50
Type : Bullish
Timeframe : Daily
Price is back over the pivot point
Type : Bullish
Timeframe : Daily
Price is back over the pivot point
Type : Bullish
Timeframe : Weekly
The Central Patterns scanner, which studies chart patterns, resistances and supports, has identified this signal:
Near support of triangle
Type : Bullish
Timeframe : Daily
The Central Candlesticks scanner, specialised in Japanese candlesticks, did not identify any signals.
| S3 | S2 | S1 | Price | R1 | R2 | R3 | |
|---|---|---|---|---|---|---|---|
| ProTrendLines | 61.06 | 65.47 | 71.90 | 72.69 | 73.73 | 75.23 | 76.56 |
| Change (%) | -16.00% | -9.93% | -1.09% | - | +1.43% | +3.49% | +5.32% |
| Change | -11.63 | -7.22 | -0.79 | - | +1.04 | +2.54 | +3.87 |
| Level | Minor | Major | Major | - | Minor | Major | Intermediate |
Pivot points can also be used to set your price objectives. Here is the price situation in relation to pivot points:
| Pivot points | S3 | S2 | S1 | PP | R1 | R2 | R3 |
|---|---|---|---|---|---|---|---|
| Standard | 70.84 | 71.34 | 72.10 | 72.60 | 73.36 | 73.86 | 74.62 |
| Camarilla | 72.51 | 72.63 | 72.75 | 72.86 | 72.98 | 73.09 | 73.21 |
| Woodie | 70.97 | 71.41 | 72.23 | 72.67 | 73.49 | 73.93 | 74.75 |
| Fibonacci | 71.34 | 71.82 | 72.12 | 72.60 | 73.08 | 73.38 | 73.86 |
| Pivot points | S3 | S2 | S1 | PP | R1 | R2 | R3 |
|---|---|---|---|---|---|---|---|
| Standard | 69.76 | 70.47 | 71.67 | 72.38 | 73.58 | 74.29 | 75.49 |
| Camarilla | 72.34 | 72.51 | 72.69 | 72.86 | 73.04 | 73.21 | 73.39 |
| Woodie | 70.00 | 70.59 | 71.91 | 72.50 | 73.82 | 74.41 | 75.73 |
| Fibonacci | 70.47 | 71.20 | 71.65 | 72.38 | 73.11 | 73.56 | 74.29 |
| Pivot points | S3 | S2 | S1 | PP | R1 | R2 | R3 |
|---|---|---|---|---|---|---|---|
| Standard | 64.13 | 66.53 | 69.78 | 72.18 | 75.43 | 77.83 | 81.08 |
| Camarilla | 71.48 | 71.99 | 72.51 | 73.03 | 73.55 | 74.07 | 74.59 |
| Woodie | 64.55 | 66.74 | 70.20 | 72.39 | 75.86 | 78.05 | 81.51 |
| Fibonacci | 66.53 | 68.69 | 70.02 | 72.18 | 74.34 | 75.67 | 77.83 |
Numerical data
The following is the status of technical indicators and moving averages registered at the time this technical analysis was created:
| RSI (14): | 51.69 | |
| MACD (12,26,9): | 0.1500 | |
| Directional Movement: | 0.57 | |
| AROON (14): | -64.28 | |
| DEMA (21): | 72.86 | |
| Parabolic SAR (0,02-0,02-0,2): | 73.96 | |
| Elder Ray (13): | -0.18 | |
| Super Trend (3,10): | 70.93 | |
| Zig ZAG (10): | 72.69 | |
| VORTEX (21): | 1.0300 | |
| Stochastique (14,3,5): | 37.12 | |
| TEMA (21): | 72.54 | |
| Williams %R (14): | -57.39 | |
| Chande Momentum Oscillator (20): | -1.36 | |
| Repulse (5,40,3): | 1.5000 | |
| ROCnROLL: | 1 | |
| TRIX (15,9): | 0.0600 | |
| Courbe Coppock: | 0.97 |
| MA7: | 72.33 | |
| MA20: | 72.83 | |
| MA50: | 72.27 | |
| MA100: | 69.61 | |
| MAexp7: | 72.55 | |
| MAexp20: | 72.58 | |
| MAexp50: | 71.69 | |
| MAexp100: | 69.57 | |
| Price / MA7: | +0.50% | |
| Price / MA20: | -0.19% | |
| Price / MA50: | +0.58% | |
| Price / MA100: | +4.42% | |
| Price / MAexp7: | +0.19% | |
| Price / MAexp20: | +0.15% | |
| Price / MAexp50: | +1.39% | |
| Price / MAexp100: | +4.48% |
News
The latest news and videos published on VENTAS INC. at the time of the analysis were as follows:
- Ventas Announces Third Quarter 2019 Earnings Release Date and Conference Call
- Ventas Declares Regular Quarterly Dividend of $0.7925 Per Share
- Ventas Named to Dow Jones Sustainability World Index for First Time
- Ventas to Participate in BMO Capital Markets 14th Annual Real Estate Conference
- Ventas to Participate in Bank of America Merrill Lynch 2019 Global Real Estate Conference
About author

Online


Add a comment
Comments
0 comments on the analysis VENTAS INC. - Daily