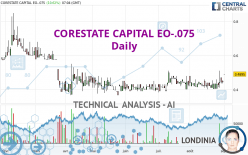
CORESTATE CAPITAL EO-.075 - Daily - Technical analysis published on 09/01/2023 (GMT)
- 136
- 0
Click here for a new analysis!
- Timeframe : Daily
- - Analysis generated on
- Status : TARGET REACHED
Summary of the analysis

Additional analysis
Quotes
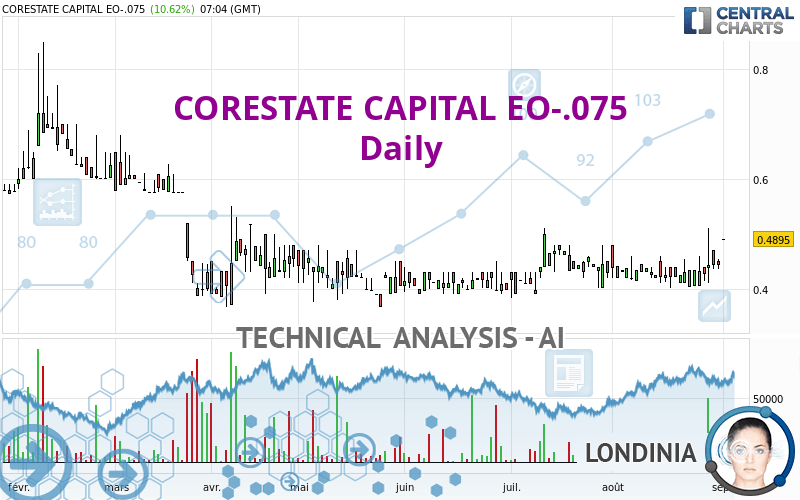
CORESTATE CAPITAL EO-.075 rating 0.4895 EUR. On the day, this instrument gained +10.62% and was traded between 0.4895 EUR and 0.4895 EUR over the period. The price is currently at 0% from its lowest and 0% from its highest.The Central Gaps scanner detects the formation of a bullish gap marking the strong presence of buyers against sellers at the opening. This formed a quotation gap.
Opening Gap UP
Type : Bullish
Timeframe : Openning
A study of price movements over other periods shows the following variations:
Near a new HIGH record (1 month)
Type : Bullish
Timeframe : Weekly
Technical
Technical analysis of this Daily chart of CORESTATE CAPITAL EO-.075 indicates that the overall trend is bullish. The signals given by moving averages are 78.57% bullish. This bullish trend is slowing down slightly given the slightly bullish signals of short-term moving averages. The Central Indicators market scanner is currently detecting several bullish signals that could impact this trend:
Moving Average bullish crossovers : MA20 & MA50
Type : Bullish
Timeframe : Daily
Bullish price crossover with adaptative moving average 50
Type : Bullish
Timeframe : Daily
Bullish price crossover with adaptative moving average 100
Type : Bullish
Timeframe : Daily
In fact, 16 technical indicators on 18 studied are currently bullish. Caution: the Central Indicators scanner currently detects an excess:
RSI indicator is overbought : over 70
Type : Neutral
Timeframe : Daily
CCI indicator is overbought : over 100
Type : Neutral
Timeframe : Daily
Williams %R indicator is overbought : over -20
Type : Neutral
Timeframe : Daily
Pivot points : price is over resistance 2
Type : Neutral
Timeframe : Weekly
Pivot points : price is over resistance 3
Type : Neutral
Timeframe : Daily
Ichimoku : price is over the cloud
Type : Bullish
Timeframe : Daily
Central Patterns, the scanner specializing in chart patterns, did not identify any signals.
The Central Candlesticks scanner currently notes the presence of this pattern in Japanese candlesticks that could mark the end of the short-term trend currently underway:
Doji
Type : Neutral
Timeframe : Daily
| S2 | S1 | Price | R1 | R2 | R3 | |
|---|---|---|---|---|---|---|
| ProTrendLines | 0.3055 | 0.4025 | 0.4895 | 0.5002 | 0.5946 | 0.7200 |
| Change (%) | -37.59% | -17.77% | - | +2.19% | +21.47% | +47.09% |
| Change | -0.1840 | -0.0870 | - | +0.0107 | +0.1051 | +0.2305 |
| Level | Minor | Major | - | Intermediate | Minor | Major |
Pivot points can also be used to set your price objectives. Here is the price situation in relation to pivot points:
| Pivot points | S3 | S2 | S1 | PP | R1 | R2 | R3 |
|---|---|---|---|---|---|---|---|
| Standard | 0.4168 | 0.4262 | 0.4343 | 0.4437 | 0.4518 | 0.4612 | 0.4693 |
| Camarilla | 0.4377 | 0.4393 | 0.4409 | 0.4425 | 0.4441 | 0.4457 | 0.4473 |
| Woodie | 0.4163 | 0.4259 | 0.4338 | 0.4434 | 0.4513 | 0.4609 | 0.4688 |
| Fibonacci | 0.4262 | 0.4329 | 0.4370 | 0.4437 | 0.4504 | 0.4545 | 0.4612 |
| Pivot points | S3 | S2 | S1 | PP | R1 | R2 | R3 |
|---|---|---|---|---|---|---|---|
| Standard | 0.3473 | 0.3752 | 0.4038 | 0.4317 | 0.4603 | 0.4882 | 0.5168 |
| Camarilla | 0.4170 | 0.4221 | 0.4273 | 0.4325 | 0.4377 | 0.4429 | 0.4480 |
| Woodie | 0.3478 | 0.3754 | 0.4043 | 0.4319 | 0.4608 | 0.4884 | 0.5173 |
| Fibonacci | 0.3752 | 0.3968 | 0.4101 | 0.4317 | 0.4533 | 0.4666 | 0.4882 |
| Pivot points | S3 | S2 | S1 | PP | R1 | R2 | R3 |
|---|---|---|---|---|---|---|---|
| Standard | 0.2842 | 0.3428 | 0.3927 | 0.4513 | 0.5012 | 0.5598 | 0.6097 |
| Camarilla | 0.4127 | 0.4226 | 0.4326 | 0.4425 | 0.4525 | 0.4624 | 0.4723 |
| Woodie | 0.2798 | 0.3406 | 0.3883 | 0.4491 | 0.4968 | 0.5576 | 0.6053 |
| Fibonacci | 0.3428 | 0.3843 | 0.4099 | 0.4513 | 0.4928 | 0.5184 | 0.5598 |
Numerical data
The following is the status of technical indicators and moving averages registered at the time this technical analysis was created:
| RSI (14): | 71.34 | |
| MACD (12,26,9): | 0.0057 | |
| Directional Movement: | 28.2382 | |
| AROON (14): | 57.1428 | |
| DEMA (21): | 0.4444 | |
| Parabolic SAR (0,02-0,02-0,2): | 0.4160 | |
| Elder Ray (13): | 0.0472 | |
| Super Trend (3,10): | 0.3802 | |
| Zig ZAG (10): | 0.4895 | |
| VORTEX (21): | 1.0060 | |
| Stochastique (14,3,5): | 52.23 | |
| TEMA (21): | 0.4491 | |
| Williams %R (14): | -18.89 | |
| Chande Momentum Oscillator (20): | 0.0640 | |
| Repulse (5,40,3): | -4.0676 | |
| ROCnROLL: | 1 | |
| TRIX (15,9): | 0.0080 | |
| Courbe Coppock: | 8.29 |
| MA7: | 0.4443 | |
| MA20: | 0.4335 | |
| MA50: | 0.4335 | |
| MA100: | 0.4302 | |
| MAexp7: | 0.4501 | |
| MAexp20: | 0.4389 | |
| MAexp50: | 0.4359 | |
| MAexp100: | 0.4603 | |
| Price / MA7: | +10.17% | |
| Price / MA20: | +12.92% | |
| Price / MA50: | +12.92% | |
| Price / MA100: | +13.78% | |
| Price / MAexp7: | +8.75% | |
| Price / MAexp20: | +11.53% | |
| Price / MAexp50: | +12.30% | |
| Price / MAexp100: | +6.34% |
News
The latest news and videos published on CORESTATE CAPITAL EO-.075 at the time of the analysis were as follows:
- EQS-News: Corestate Capital Holding S.A.: Corestate successfully completes financial restructuring
- EQS-News: Corestate Capital Holding S.A.: Corestate: Extraordinary General Meeting votes with large majority for restructuring of share capital
- HANNOVER LEASING Group sets strategic course and strengthens core business with institutional clients
- EQS-News: Corestate Capital Holding S.A.: CONVENING NOTICE TO THE RECONVENED EXTRAORDINARY GENERAL MEETING OF THE SHAREHOLDERS
- EQS-News: Corestate Capital Holding S.A.: Noteholders' meetings approve bond restructuring with large majority – important milestone for debt reduction reached
About author
Online


Add a comment
Comments
0 comments on the analysis CORESTATE CAPITAL EO-.075 - Daily