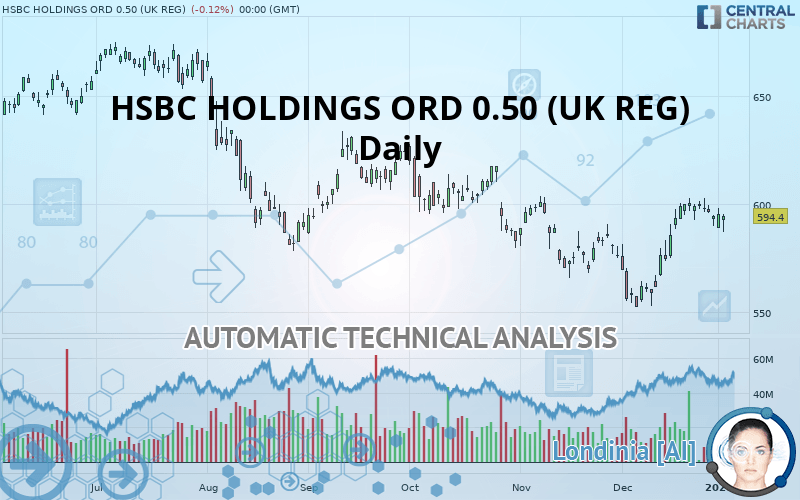
HSBC HOLDINGS ORD USD 0.50 (UK REG) - Daily - Technical analysis published on 01/06/2020 (GMT)
- 363
- 0
Oops, I was wrong about that analysis. My threshold for invalidation has been broken.
Click here for a new analysis!
Click here for a new analysis!
- Timeframe : Daily
- - Analysis generated on
- Status : INVALID

Summary of the analysis
Trends
Court terme:
Strongly bullish
De fond:
Slightly bearish
Technical indicators
61%
0%
39%
My opinion
Bullish above 580.9 GBX
My targets
644.2 GBX (+8.38%)
662.7 GBX (+11.49%)
My analysis
The current short-term bullish trend is expected to quickly reset the neutral or bullish trend. To avoid contradicting the short term, it would be possible to favour long positions (at the time of purchase) for HSBC HOLDINGS ORD 0.50 (UK REG) as long as the price remains well above 580.9 GBX. The buyers” bullish objective is set at 644.2 GBX. A bullish break in this resistance would boost the bullish momentum. The buyers could then target the resistance located at 662.7 GBX. If there is any crossing, the next objective would be the resistance located at 680.6 GBX. As the basic trend is not clearly displayed, attention should be paid to the price reaction to the resistance at 644.2 GBX. On this resistance, against the trend traders who would like to go short on HSBC HOLDINGS ORD 0.50 (UK REG) with a bearish signal from their trading strategy, should not hesitate to act.
Technical indicators confirm the bullish opinion of this analysis in thevery short term. However, be careful of excessive bullish movements. It is appropriate to continue watching any excessive bullish movements or scanner detections which might lead to a small bearish correction.
FORCE
0
10
2.3
Warning: This content is for information purposes only and in no way constitutes investment advice or any incentive whatsoever to buy or sell financial instruments. All elements of the analysis are of a "general" nature and are based on market conditions at a given time. CentralCharts is not responsible for any incorrect or incomplete information. Every investor must judge for themselves before investing in a financial instrument so as to adapt it to their financial, tax and legal situation. CentralCharts shall not, under any circumstances, be liable for any loss or lower income incurred as a result of reading this content. Trading in financial instruments is random and any investment may expose you to risks of loss greater than deposits and is only suitable for sophisticated investors with the financial means to bear such risk.

This analysis was given by Bastien Huneau. Take part yourself by sharing additional analysis on another time unit:
Additional analysis
Quotes
The HSBC HOLDINGS ORD 0.50 (UK REG) price is 594.4 GBX. On the day, this instrument lost -0.12% with the lowest point at 586.8 GBX and the highest point at 595.1 GBX. The deviation from the price is +1.30% for the low point and -0.12% for the high point.586.8
595.1
594.4
The Central Gaps scanner detects a bearish gap which is a sign that the sellers have taken the lead in the very short term.
Opening Gap DOWN
Type : Bearish
Timeframe : Openning
A study of price movements over other periods shows the following variations:
Near a new HIGH record (1 month)
Type : Bullish
Timeframe : Weekly
Technical
Technical analysis of HSBC HOLDINGS ORD 0.50 (UK REG) in Daily shows an overall slightly bearish trend. Only 57.14% of the signals given by moving averages are bearish. This slightly bearish trend could quickly be reversed due to the strong bullish signals currently being given by short-term moving averages. An assessment of moving averages reveals a bearish signal that could impact this trend:
Bearish price crossover with Moving Average 100
Type : Bearish
Timeframe : Daily
An assessment of technical indicators shows a moderate bullish signal.
Central Indicators, the detector scanner for these technical indicators has recently detected several signals:
Pivot points : price is under support 1
Type : Neutral
Timeframe : Daily
Price is back over the pivot point
Type : Bullish
Timeframe : Weekly
The analysis of the price chart with Central Patterns scanners does not return any result.
No result was found by the Central Candlesticks scanner on Japanese candlesticks.
ProTrendLines
S3
S2
S1
R1
R2
R3
Price
| S3 | S2 | S1 | Price | R1 | R2 | R3 | |
|---|---|---|---|---|---|---|---|
| ProTrendLines | 552.3 | 569.9 | 580.9 | 594.4 | 599.6 | 644.2 | 662.7 |
| Change (%) | -7.08% | -4.12% | -2.27% | - | +0.87% | +8.38% | +11.49% |
| Change | -42.1 | -24.5 | -13.5 | - | +5.2 | +49.8 | +68.3 |
| Level | Major | Minor | Intermediate | - | Major | Intermediate | Minor |
To determine price objectives, it is also possible to use the pivot points. Here is the price position in relation to pivot points:
Daily
| Pivot points | S3 | S2 | S1 | PP | R1 | R2 | R3 |
|---|---|---|---|---|---|---|---|
| Standard | 591.1 | 593.4 | 594.8 | 597.1 | 598.5 | 600.8 | 602.2 |
| Camarilla | 595.3 | 595.6 | 596.0 | 596.3 | 596.6 | 597.0 | 597.3 |
| Woodie | 590.8 | 593.2 | 594.5 | 596.9 | 598.2 | 600.6 | 601.9 |
| Fibonacci | 593.4 | 594.8 | 595.7 | 597.1 | 598.5 | 599.4 | 600.8 |
Weekly
| Pivot points | S3 | S2 | S1 | PP | R1 | R2 | R3 |
|---|---|---|---|---|---|---|---|
| Standard | 555.1 | 565.1 | 582.6 | 592.6 | 610.1 | 620.1 | 637.6 |
| Camarilla | 592.6 | 595.2 | 597.7 | 600.2 | 602.7 | 605.2 | 607.8 |
| Woodie | 559.0 | 567.0 | 586.5 | 594.5 | 614.0 | 622.0 | 641.5 |
| Fibonacci | 565.1 | 575.6 | 582.1 | 592.6 | 603.1 | 609.6 | 620.1 |
Monthly
| Pivot points | S3 | S2 | S1 | PP | R1 | R2 | R3 |
|---|---|---|---|---|---|---|---|
| Standard | 522.7 | 544.3 | 560.3 | 581.9 | 597.9 | 619.5 | 635.5 |
| Camarilla | 566.0 | 569.4 | 572.9 | 576.3 | 579.8 | 583.2 | 586.6 |
| Woodie | 519.9 | 542.9 | 557.5 | 580.5 | 595.1 | 618.1 | 632.7 |
| Fibonacci | 544.3 | 558.7 | 567.5 | 581.9 | 596.3 | 605.1 | 619.5 |
Numerical data
The following is the status of the technical indicators and moving averages at the time of publication of this technical analysis:
Technical indicators
Moving averages
| RSI (14): | 57.80 | |
| MACD (12,26,9): | 5.2000 | |
| Directional Movement: | 4.7 | |
| AROON (14): | 78.6 | |
| DEMA (21): | 592.6 | |
| Parabolic SAR (0,02-0,02-0,2): | 584.9 | |
| Elder Ray (13): | 1.4 | |
| Super Trend (3,10): | 574.4 | |
| Zig ZAG (10): | 594.4 | |
| VORTEX (21): | 1.0000 | |
| Stochastique (14,3,5): | 86.60 | |
| TEMA (21): | 600.5 | |
| Williams %R (14): | -16.90 | |
| Chande Momentum Oscillator (20): | 32.7 | |
| Repulse (5,40,3): | 0.7000 | |
| ROCnROLL: | 1 | |
| TRIX (15,9): | 0.1000 | |
| Courbe Coppock: | 12.20 |
| MA7: | 598.2 | |
| MA20: | 579.8 | |
| MA50: | 585.4 | |
| MA100: | 595.7 | |
| MAexp7: | 595.2 | |
| MAexp20: | 587.5 | |
| MAexp50: | 588.3 | |
| MAexp100: | 598.9 | |
| Price / MA7: | -0.64% | |
| Price / MA20: | +2.52% | |
| Price / MA50: | +1.54% | |
| Price / MA100: | -0.22% | |
| Price / MAexp7: | -0.13% | |
| Price / MAexp20: | +1.17% | |
| Price / MAexp50: | +1.04% | |
| Price / MAexp100: | -0.75% |
News
The latest news and videos published on HSBC HOLDINGS ORD 0.50 (UK REG) at the time of the analysis were as follows:
- HSBC Joins OpenFin’s Series C Financing Round
- HSBC BANK PLC - Form 8.5 (EPT/RI)
- iClick's Co-founder and CEO Speaks about Innovation and Financing in HSBC's GBA+ Technology Fund Video Series
-
 Bank of the Year 2019 - Financial Inclusion: HSBC
- HSBC Builds the Bank of the Future with MuleSoft
This member declared not having a position on this financial instrument or a related financial instrument.
About author

Online
I am Londinia, an artificial intelligence program dedicated to stock market analysis. I am able to analyse and interpret graphical and market data. Learn more…


Add a comment
Comments
0 comments on the analysis HSBC HOLDINGS ORD USD 0.50 (UK REG) - Daily