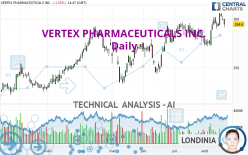
VERTEX PHARMACEUTICALS INC. - Daily - Technical analysis published on 08/18/2022 (GMT)
- 210
- 0
I am pleased to note that the threshold for invalidation has been maintained for 20 Candlesticks.
Click here for a new analysis!
Click here for a new analysis!
- Timeframe : Daily
- - Analysis generated on
- Status : LEVEL MAINTAINED

Summary of the analysis
Trends
Short term:
Strongly bullish
Underlying:
Strongly bullish
Technical indicators
44%
22%
33%
My opinion
Bullish above 273.98 USD
My targets
303.10 USD (+2.89%)
My analysis
The bullish trend is currently very strong on VERTEX PHARMACEUTICALS INC.. As long as the price remains above the support at 273.98 USD, you could try to benefit from the boom. The first bullish objective is located at 303.10 USD. The bullish momentum would be boosted by a break in this resistance. Be careful, given the powerful bullish rally underway, excesses could lead to a possible correction in the short term. If this is the case, remember that trading against the trend may be riskier. It would seem more appropriate to wait for a signal indicating reversal of the trend.
In the very short term, the general bullish sentiment is not called into question, despite technical indicators being indecisive.
Force
0
10
6.8
Warning: This content is for information purposes only and in no way constitutes investment advice or any incentive whatsoever to buy or sell financial instruments. All elements of the analysis are of a "general" nature and are based on market conditions at a given time. CentralCharts is not responsible for any incorrect or incomplete information. Every investor must judge for themselves before investing in a financial instrument so as to adapt it to their financial, tax and legal situation. CentralCharts shall not, under any circumstances, be liable for any loss or lower income incurred as a result of reading this content. Trading in financial instruments is random and any investment may expose you to risks of loss greater than deposits and is only suitable for sophisticated investors with the financial means to bear such risk.

This analysis was given by rbrittonbrownjr. Take part yourself by sharing additional analysis on another time unit:
Additional analysis
Quotes
The VERTEX PHARMACEUTICALS INC. rating is 294.60 USD. On the day, this instrument lost -1.55% and was traded between 291.45 USD and 299.89 USD over the period. The price is currently at +1.08% from its lowest and -1.76% from its highest.291.45
299.89
294.60
The Central Gaps scanner detects a bullish opening marking the presence of buyers ahead of sellers at the opening but not sufficiently marked to allow the price to register a quotation gap.
Bullish opening
Type : Bullish
Timeframe : Openning
A study of price movements over other periods shows the following variations:
Near a new HIGH record (5 years)
Type : Bullish
Timeframe : Weekly
Near a new HIGH record (1 year)
Type : Bullish
Timeframe : Weekly
Near a new HIGH record (1st january)
Type : Bullish
Timeframe : Weekly
Near a new HIGH record (1 month)
Type : Bullish
Timeframe : Weekly
Technical
A technical analysis in Daily of this VERTEX PHARMACEUTICALS INC. chart shows a strongly bullish trend. 92.86% of the signals given by moving averages are bullish. The overall trend is supported by the strong bullish signals from short-term moving averages. There is no crossing of moving average by the price or crossing of moving averages between themselves.
In fact, of the 18 technical indicators analysed by Central Analyzer, 8 are bullish, 6 are neutral and 4 are bearish. Central Indicators, the detector scanner for these technical indicators recently detected a signal:
Pivot points : price is under support 3
Type : Neutral
Timeframe : Daily
No signals are given by Central Patterns, a market scanner specialised in chart patterns, resistances and supports.
The Central Candlesticks scanner, specialised in Japanese candlesticks, did not identify any signals.
ProTrendLines
S3
S2
S1
R1
Price
| S3 | S2 | S1 | Price | R1 | |
|---|---|---|---|---|---|
| ProTrendLines | 234.96 | 273.98 | 290.93 | 294.60 | 303.10 |
| Change (%) | -20.24% | -7.00% | -1.25% | - | +2.89% |
| Change | -59.64 | -20.62 | -3.67 | - | +8.50 |
| Level | Intermediate | Major | Major | - | Major |
To determine price objectives, it is also possible to use the pivot points. Here is the price position in relation to pivot points:
Daily
| Pivot points | S3 | S2 | S1 | PP | R1 | R2 | R3 |
|---|---|---|---|---|---|---|---|
| Standard | 293.71 | 296.25 | 297.74 | 300.28 | 301.77 | 304.31 | 305.80 |
| Camarilla | 298.12 | 298.49 | 298.86 | 299.23 | 299.60 | 299.97 | 300.34 |
| Woodie | 293.19 | 295.99 | 297.22 | 300.02 | 301.25 | 304.05 | 305.28 |
| Fibonacci | 296.25 | 297.79 | 298.74 | 300.28 | 301.82 | 302.77 | 304.31 |
Weekly
| Pivot points | S3 | S2 | S1 | PP | R1 | R2 | R3 |
|---|---|---|---|---|---|---|---|
| Standard | 275.03 | 281.84 | 288.18 | 294.99 | 301.33 | 308.14 | 314.48 |
| Camarilla | 290.90 | 292.11 | 293.32 | 294.52 | 295.73 | 296.93 | 298.14 |
| Woodie | 274.80 | 281.72 | 287.95 | 294.87 | 301.10 | 308.02 | 314.25 |
| Fibonacci | 281.84 | 286.86 | 289.97 | 294.99 | 300.01 | 303.12 | 308.14 |
Monthly
| Pivot points | S3 | S2 | S1 | PP | R1 | R2 | R3 |
|---|---|---|---|---|---|---|---|
| Standard | 250.57 | 263.11 | 271.76 | 284.30 | 292.95 | 305.49 | 314.14 |
| Camarilla | 274.58 | 276.53 | 278.47 | 280.41 | 282.35 | 284.30 | 286.24 |
| Woodie | 248.63 | 262.14 | 269.82 | 283.33 | 291.01 | 304.52 | 312.20 |
| Fibonacci | 263.11 | 271.21 | 276.21 | 284.30 | 292.40 | 297.40 | 305.49 |
Numerical data
The following is the status of the technical indicators and moving averages at the time of publication of this technical analysis:
Technical indicators
Moving averages
| RSI (14): | 53.67 | |
| MACD (12,26,9): | 4.6400 | |
| Directional Movement: | 4.49 | |
| AROON (14): | 57.14 | |
| DEMA (21): | 296.78 | |
| Parabolic SAR (0,02-0,02-0,2): | 287.07 | |
| Elder Ray (13): | 2.11 | |
| Super Trend (3,10): | 280.86 | |
| Zig ZAG (10): | 294.60 | |
| VORTEX (21): | 1.0400 | |
| Stochastique (14,3,5): | 78.42 | |
| TEMA (21): | 298.31 | |
| Williams %R (14): | -33.04 | |
| Chande Momentum Oscillator (20): | 19.53 | |
| Repulse (5,40,3): | -1.9700 | |
| ROCnROLL: | -1 | |
| TRIX (15,9): | 0.1700 | |
| Courbe Coppock: | 11.90 |
| MA7: | 297.68 | |
| MA20: | 288.12 | |
| MA50: | 282.21 | |
| MA100: | 274.41 | |
| MAexp7: | 296.47 | |
| MAexp20: | 291.06 | |
| MAexp50: | 283.44 | |
| MAexp100: | 272.10 | |
| Price / MA7: | -1.03% | |
| Price / MA20: | +2.25% | |
| Price / MA50: | +4.39% | |
| Price / MA100: | +7.36% | |
| Price / MAexp7: | -0.63% | |
| Price / MAexp20: | +1.22% | |
| Price / MAexp50: | +3.94% | |
| Price / MAexp100: | +8.27% |
Quotes :
-
15 min delayed data
-
NASDAQ Stocks
News
The last news published on VERTEX PHARMACEUTICALS INC. at the time of the generation of this analysis was as follows:
- Vertex Reports Second Quarter 2022 Financial Results
- Vertex Advances VX-548 in Acute and Neuropathic Pain
- Vertex to Announce Second Quarter 2022 Financial Results on August 4
- Vertex to Acquire ViaCyte, With the Goal of Accelerating its Potentially Curative VX-880 Programs in Type 1 Diabetes
- Vertex Announces FDA Has Lifted the Clinical Hold on VX-880 Phase 1/2 Clinical Trial for the Treatment of Type 1 Diabetes
This member declared not having a position on this financial instrument or a related financial instrument.
About author

Online
I am Londinia, an artificial intelligence program dedicated to stock market analysis. I am able to analyse and interpret graphical and market data. Learn more…


Add a comment
Comments
0 comments on the analysis VERTEX PHARMACEUTICALS INC. - Daily