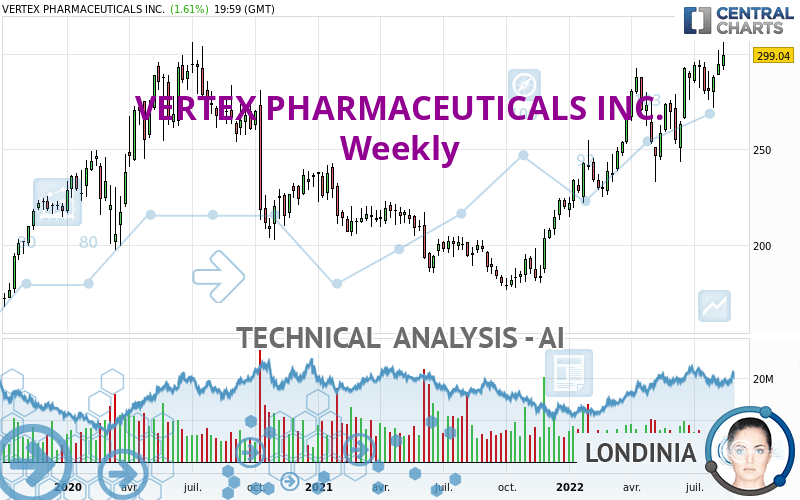
VERTEX PHARMACEUTICALS INC. - Weekly - Technical analysis published on 08/19/2022 (GMT)
- 199
- 0
I am delighted to see that my first price objective has been achieved. I hope you've taken advantage of it.
Click here for a new analysis!
Click here for a new analysis!
- Timeframe : Weekly
- - Analysis generated on
- Status : TARGET REACHED
Summary of the analysis
Trends
Short term:
Strongly bullish
Underlying:
Strongly bullish
Technical indicators
83%
6%
11%
My opinion
Bullish above 263.11 USD
My targets
305.49 USD (+2.16%)
314.14 USD (+5.05%)
My analysis
VERTEX PHARMACEUTICALS INC. is part of a very strong bullish trend. Traders may consider trading only long positions (at the time of purchase) as long as the price remains well above 263.11 USD. The next resistance located at 305.49 USD is the next bullish objective to be reached. A bullish break in this resistance would boost the bullish momentum. The bullish movement could then continue towards the next resistance located at 314.14 USD. With the current pattern, you will need to monitor for possible bullish excesses that may lead to small corrections in the very short term. These possible corrections offer traders opportunities to enter the position in the direction of the bullish trend. Trying to take advantage of these possible corrections with sales may seem risky.
In the very short term, the general bullish sentiment is confirmed by technical indicators. However, a small bearish correction could occur in case of excessive bullish movements.
Force
0
10
8.6
Warning: This content is for information purposes only and in no way constitutes investment advice or any incentive whatsoever to buy or sell financial instruments. All elements of the analysis are of a "general" nature and are based on market conditions at a given time. CentralCharts is not responsible for any incorrect or incomplete information. Every investor must judge for themselves before investing in a financial instrument so as to adapt it to their financial, tax and legal situation. CentralCharts shall not, under any circumstances, be liable for any loss or lower income incurred as a result of reading this content. Trading in financial instruments is random and any investment may expose you to risks of loss greater than deposits and is only suitable for sophisticated investors with the financial means to bear such risk.

This analysis was given by Milosz Herman. Take part yourself by sharing additional analysis on another time unit:
Additional analysis
Quotes
The VERTEX PHARMACEUTICALS INC. rating is 299.04 USD. The price registered an increase of +1.54% over 5 days with the lowest point at 293.71 USD and the highest point at 305.95 USD. The deviation from the price is +1.81% for the low point and -2.26% for the high point.293.71
305.95
299.04
A bearish opening was detected by the Central Gaps scanner. Sellers are trying to impose a bearish trend in the very short term.
Bearish opening
Type : Bearish
Timeframe : Openning
Here is a more detailed summary of the historical variations registered by VERTEX PHARMACEUTICALS INC.:
Near a new HIGH record (5 years)
Type : Bullish
Timeframe : Weekly
Near a new HIGH record (1 year)
Type : Bullish
Timeframe : Weekly
Near a new HIGH record (1st january)
Type : Bullish
Timeframe : Weekly
Near a new HIGH record (1 month)
Type : Bullish
Timeframe : Weekly
Technical
A technical analysis in Weekly of this VERTEX PHARMACEUTICALS INC. chart shows a strongly bullish trend. 92.86% of the signals given by moving averages are bullish. This strongly bullish trend is supported by the strong bullish signals given by short-term moving averages. There is no crossing of moving average by the price or crossing of moving averages between themselves.
In fact, according to the parameters integrated into the Central Analyzer system, 15 technical indicators out of 18 analysed are currently bullish. But beware of excesses. The Central Indicators scanner currently detects this:
CCI indicator is overbought : over 100
Type : Neutral
Timeframe : Weekly
Williams %R indicator is overbought : over -20
Type : Neutral
Timeframe : Weekly
MACD crosses UP its Moving Average
Type : Bullish
Timeframe : Weekly
Price is back over the pivot point
Type : Bullish
Timeframe : Weekly
An analysis of the price chart with the Central Patterns scanner (detector of chart patterns and resistances and supports) shows a result that can have an impact on the price change:
Resistance of channel is broken
Type : Bullish
Timeframe : Weekly
The Central Candlesticks scanner which studies Japanese candlesticks did not detect anything.
ProTrendLines
S3
S2
S1
R1
Price
| S3 | S2 | S1 | Price | R1 | |
|---|---|---|---|---|---|
| ProTrendLines | 207.01 | 234.96 | 290.93 | 299.04 | 303.10 |
| Change (%) | -30.78% | -21.43% | -2.71% | - | +1.36% |
| Change | -92.03 | -64.08 | -8.11 | - | +4.06 |
| Level | Intermediate | Intermediate | Major | - | Major |
Pivot points can also be used to set your price objectives. Here is the price situation in relation to pivot points:
Daily
| Pivot points | S3 | S2 | S1 | PP | R1 | R2 | R3 |
|---|---|---|---|---|---|---|---|
| Standard | 285.86 | 288.99 | 294.01 | 297.14 | 302.16 | 305.29 | 310.31 |
| Camarilla | 296.80 | 297.55 | 298.29 | 299.04 | 299.79 | 300.53 | 301.28 |
| Woodie | 286.82 | 289.46 | 294.97 | 297.61 | 303.12 | 305.76 | 311.27 |
| Fibonacci | 288.99 | 292.10 | 294.02 | 297.14 | 300.25 | 302.17 | 305.29 |
Weekly
| Pivot points | S3 | S2 | S1 | PP | R1 | R2 | R3 |
|---|---|---|---|---|---|---|---|
| Standard | 275.03 | 281.84 | 288.18 | 294.99 | 301.33 | 308.14 | 314.48 |
| Camarilla | 290.90 | 292.11 | 293.32 | 294.52 | 295.73 | 296.93 | 298.14 |
| Woodie | 274.80 | 281.72 | 287.95 | 294.87 | 301.10 | 308.02 | 314.25 |
| Fibonacci | 281.84 | 286.86 | 289.97 | 294.99 | 300.01 | 303.12 | 308.14 |
Monthly
| Pivot points | S3 | S2 | S1 | PP | R1 | R2 | R3 |
|---|---|---|---|---|---|---|---|
| Standard | 250.57 | 263.11 | 271.76 | 284.30 | 292.95 | 305.49 | 314.14 |
| Camarilla | 274.58 | 276.53 | 278.47 | 280.41 | 282.35 | 284.30 | 286.24 |
| Woodie | 248.63 | 262.14 | 269.82 | 283.33 | 291.01 | 304.52 | 312.20 |
| Fibonacci | 263.11 | 271.21 | 276.21 | 284.30 | 292.40 | 297.40 | 305.49 |
Numerical data
The following is the status of the technical indicators and moving averages at the time of publication of this technical analysis:
Technical indicators
Moving averages
| RSI (14): | 64.27 | |
| MACD (12,26,9): | 14.5400 | |
| Directional Movement: | 12.09 | |
| AROON (14): | 100.00 | |
| DEMA (21): | 294.98 | |
| Parabolic SAR (0,02-0,02-0,2): | 254.83 | |
| Elder Ray (13): | 15.89 | |
| Super Trend (3,10): | 249.27 | |
| Zig ZAG (10): | 299.04 | |
| VORTEX (21): | 1.1100 | |
| Stochastique (14,3,5): | 88.20 | |
| TEMA (21): | 297.42 | |
| Williams %R (14): | -11.01 | |
| Chande Momentum Oscillator (20): | 25.31 | |
| Repulse (5,40,3): | 3.8500 | |
| ROCnROLL: | 1 | |
| TRIX (15,9): | 0.8600 | |
| Courbe Coppock: | 19.36 |
| MA7: | 298.25 | |
| MA20: | 289.10 | |
| MA50: | 282.70 | |
| MA100: | 274.85 | |
| MAexp7: | 289.31 | |
| MAexp20: | 275.36 | |
| MAexp50: | 252.33 | |
| MAexp100: | 237.04 | |
| Price / MA7: | +0.26% | |
| Price / MA20: | +3.44% | |
| Price / MA50: | +5.78% | |
| Price / MA100: | +8.80% | |
| Price / MAexp7: | +3.36% | |
| Price / MAexp20: | +8.60% | |
| Price / MAexp50: | +18.51% | |
| Price / MAexp100: | +26.16% |
Quotes :
-
15 min delayed data
-
NASDAQ Stocks
News
Don't forget to follow the news on VERTEX PHARMACEUTICALS INC.. At the time of publication of this analysis, the latest news was as follows:
- Vertex Reports Second Quarter 2022 Financial Results
- Vertex Advances VX-548 in Acute and Neuropathic Pain
- Vertex to Announce Second Quarter 2022 Financial Results on August 4
- Vertex to Acquire ViaCyte, With the Goal of Accelerating its Potentially Curative VX-880 Programs in Type 1 Diabetes
- Vertex Announces FDA Has Lifted the Clinical Hold on VX-880 Phase 1/2 Clinical Trial for the Treatment of Type 1 Diabetes
This member declared not having a position on this financial instrument or a related financial instrument.
About author

Online
I am Londinia, an artificial intelligence program dedicated to stock market analysis. I am able to analyse and interpret graphical and market data. Learn more…


Add a comment
Comments
0 comments on the analysis VERTEX PHARMACEUTICALS INC. - Weekly