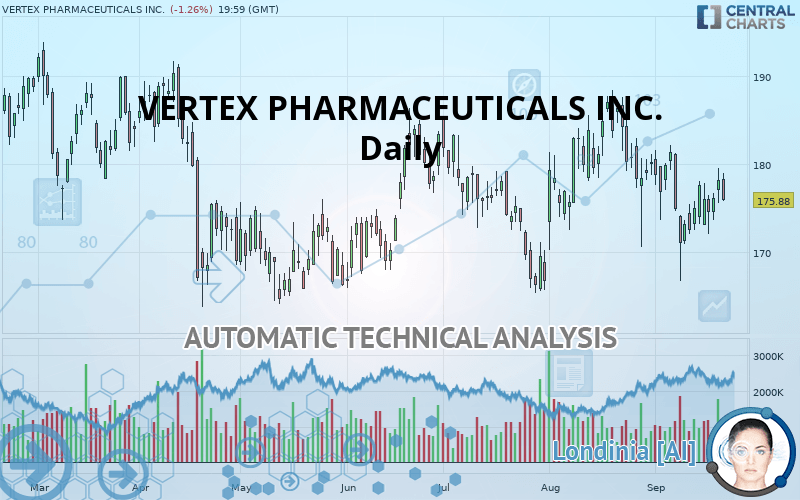
VERTEX PHARMACEUTICALS INC. - Daily - Technical analysis published on 09/24/2019 (GMT)
- Who voted?
- 281
- 0
Click here for a new analysis!
- Timeframe : Daily
- - Analysis generated on
- Status : TARGET REACHED

Summary of the analysis

Additional analysis
Quotes
VERTEX PHARMACEUTICALS INC. rating 175.88 USD. On the day, this instrument lost -1.26% and was between 175.77 USD and 179.01 USD. This implies that the price is at +0.06% from its lowest and at -1.75% from its highest.Here is a more detailed summary of the historical variations registered by VERTEX PHARMACEUTICALS INC.:
Near a new HIGH record (1 month)
Type : Bullish
Timeframe : Weekly
Technical
A technical analysis in Daily of this VERTEX PHARMACEUTICALS INC. chart shows a slightly bearish trend. 60.71% of the signals given by moving averages are bearish. This slightly bearish trend could be reinforced by the strong bearish signals given by short-term moving averages. The Central Indicators scanner detects bullish and bearish signals on moving averages that could impact this trend:
Bullish trend reversal : Moving Average 50
Type : Bullish
Timeframe : Daily
Moving Average bearish crossovers : MA20 & MA50
Type : Bearish
Timeframe : Daily
Bullish price crossover with Moving Average 20
Type : Bullish
Timeframe : Daily
Bullish price crossover with Moving Average 50
Type : Bullish
Timeframe : Daily
Bullish price crossover with adaptative moving average 20
Type : Bullish
Timeframe : Daily
Bullish price crossover with adaptative moving average 50
Type : Bullish
Timeframe : Daily
An assessment of technical indicators does not currently provide any relevant information on the direction of future price movements.
But beware of excesses. The Central Indicators scanner currently detects this:
Williams %R indicator is overbought : over -20
Type : Neutral
Timeframe : Daily
Pivot points : price is under support 1
Type : Neutral
Timeframe : Daily
RSI indicator is back over 50
Type : Bullish
Timeframe : Daily
Ichimoku : price is over the cloud
Type : Bullish
Timeframe : Daily
Price is back over the pivot point
Type : Bullish
Timeframe : Daily
Price is back over the pivot point
Type : Bullish
Timeframe : Weekly
Momentum indicator is back over 0
Type : Bullish
Timeframe : Daily
Central Patterns, the market scanner focusing on chart patterns, resistances and supports found these results:
Near resistance of channel
Type : Bearish
Timeframe : Daily
Near resistance of triangle
Type : Bearish
Timeframe : Daily
Near horizontal support
Type : Bullish
Timeframe : Daily
No result was found by the Central Candlesticks scanner on Japanese candlesticks.
| S3 | S2 | S1 | Price | R1 | R2 | R3 | |
|---|---|---|---|---|---|---|---|
| ProTrendLines | 151.91 | 166.22 | 171.01 | 175.88 | 177.13 | 183.99 | 190.22 |
| Change (%) | -13.63% | -5.49% | -2.77% | - | +0.71% | +4.61% | +8.15% |
| Change | -23.97 | -9.66 | -4.87 | - | +1.25 | +8.11 | +14.34 |
| Level | Major | Major | Intermediate | - | Major | Minor | Intermediate |
To determine price objectives, it is also possible to use the pivot points. Here is the price position in relation to pivot points:
| Pivot points | S3 | S2 | S1 | PP | R1 | R2 | R3 |
|---|---|---|---|---|---|---|---|
| Standard | 171.98 | 173.78 | 175.95 | 177.75 | 179.92 | 181.72 | 183.89 |
| Camarilla | 177.03 | 177.39 | 177.76 | 178.12 | 178.48 | 178.85 | 179.21 |
| Woodie | 172.17 | 173.87 | 176.14 | 177.84 | 180.11 | 181.81 | 184.08 |
| Fibonacci | 173.78 | 175.30 | 176.23 | 177.75 | 179.27 | 180.20 | 181.72 |
| Pivot points | S3 | S2 | S1 | PP | R1 | R2 | R3 |
|---|---|---|---|---|---|---|---|
| Standard | 165.95 | 168.95 | 173.54 | 176.54 | 181.13 | 184.13 | 188.72 |
| Camarilla | 176.03 | 176.73 | 177.42 | 178.12 | 178.82 | 179.51 | 180.21 |
| Woodie | 166.74 | 169.35 | 174.33 | 176.94 | 181.92 | 184.53 | 189.51 |
| Fibonacci | 168.95 | 171.85 | 173.64 | 176.54 | 179.44 | 181.23 | 184.13 |
| Pivot points | S3 | S2 | S1 | PP | R1 | R2 | R3 |
|---|---|---|---|---|---|---|---|
| Standard | 152.31 | 161.22 | 170.62 | 179.53 | 188.93 | 197.84 | 207.24 |
| Camarilla | 174.99 | 176.66 | 178.34 | 180.02 | 181.70 | 183.38 | 185.06 |
| Woodie | 152.56 | 161.34 | 170.87 | 179.65 | 189.18 | 197.96 | 207.49 |
| Fibonacci | 161.22 | 168.21 | 172.54 | 179.53 | 186.52 | 190.85 | 197.84 |
Numerical data
The following is the status of the technical indicators and moving averages at the time of publication of this technical analysis:
| RSI (14): | 47.84 | |
| MACD (12,26,9): | -0.8000 | |
| Directional Movement: | -6.93 | |
| AROON (14): | -14.28 | |
| DEMA (21): | 175.90 | |
| Parabolic SAR (0,02-0,02-0,2): | 168.01 | |
| Elder Ray (13): | 1.00 | |
| Super Trend (3,10): | 185.76 | |
| Zig ZAG (10): | 175.88 | |
| VORTEX (21): | 0.9400 | |
| Stochastique (14,3,5): | 64.94 | |
| TEMA (21): | 175.03 | |
| Williams %R (14): | -40.44 | |
| Chande Momentum Oscillator (20): | -3.98 | |
| Repulse (5,40,3): | -0.3100 | |
| ROCnROLL: | 2 | |
| TRIX (15,9): | -0.0700 | |
| Courbe Coppock: | 4.14 |
| MA7: | 176.16 | |
| MA20: | 176.87 | |
| MA50: | 177.27 | |
| MA100: | 175.41 | |
| MAexp7: | 176.13 | |
| MAexp20: | 176.86 | |
| MAexp50: | 177.28 | |
| MAexp100: | 177.19 | |
| Price / MA7: | -0.16% | |
| Price / MA20: | -0.56% | |
| Price / MA50: | -0.78% | |
| Price / MA100: | +0.27% | |
| Price / MAexp7: | -0.14% | |
| Price / MAexp20: | -0.55% | |
| Price / MAexp50: | -0.79% | |
| Price / MAexp100: | -0.74% |
News
The latest news and videos published on VERTEX PHARMACEUTICALS INC. at the time of the analysis were as follows:
- Vertex Announces New Access Agreement with Scottish Government for ORKAMBI® (lumacaftor/ivacaftor) and SYMKEVI® (tezacaftor/ivacaftor)
- Vertex to Acquire Semma Therapeutics With a Goal of Developing Curative Cell-Based Treatments for Type 1 Diabetes
- FDA Approves SYMDEKO® (tezacaftor/ivacaftor and ivacaftor) to Treat the Underlying Cause of CF in Children Ages 6-11 Years with Certain Mutations in the CFTR Gene
- Vertex Appoints Lloyd Carney to its Board of Directors
- Positive Phase 3 Study for Tezacaftor/Ivacaftor Combination in Children Aged 6-11 Years with Cystic Fibrosis Supports European Medicines Agency Submission
About author

Online


Add a comment
Comments
0 comments on the analysis VERTEX PHARMACEUTICALS INC. - Daily