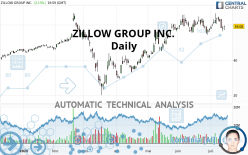
ZILLOW GROUP INC. - Daily - Technical analysis published on 07/15/2020 (GMT)
- Who voted?
- 254
- 0
- Timeframe : Daily
- - Analysis generated on
- Status : NEUTRAL

Summary of the analysis

Additional analysis
Quotes
ZILLOW GROUP INC. rating 59.08 USD. On the day, this instrument gained +2.13% with the lowest point at 57.05 USD and the highest point at 59.70 USD. The deviation from the price is +3.56% for the low point and -1.04% for the high point.The Central Gaps scanner detects a bullish opening. A small advantage for buyers in the very short term.
Bullish opening
Type : Bullish
Timeframe : Openning
A study of price movements over other periods shows the following variations:
Near a new LOW record (1 month)
Type : Bearish
Timeframe : Weekly
Technical
Technical analysis of this Daily chart of ZILLOW GROUP INC. indicates that the overall trend is slightly bullish. 60.71% of the signals given by moving averages are bullish. As the signals currently given by short-term moving averages are rather neutral, the overall trend could quickly return to neutral as well. The Central Indicators scanner detects bearish signals on moving averages that could impact this trend:
Bearish trend reversal : Moving Average 20
Type : Bearish
Timeframe : Daily
Bearish trend reversal : Moving Average 100
Type : Bearish
Timeframe : Daily
Moving Average bearish crossovers : AMA20 & AMA50
Type : Bearish
Timeframe : Daily
In fact, only 8 technical indicators out of 18 studied are currently positioned bearish. Central Indicators, the scanner specialised in technical indicators, has identified these signals:
Pivot points : price is under support 1
Type : Neutral
Timeframe : Weekly
Parabolic SAR indicator bearish reversal
Type : Bearish
Timeframe : Daily
Price is back under the pivot point
Type : Bearish
Timeframe : Daily
Central Patterns, the market scanner focusing on chart patterns, resistances and supports found these results:
Near horizontal resistance
Type : Bearish
Timeframe : Daily
Near support of channel
Type : Bullish
Timeframe : Daily
Near support of triangle
Type : Bullish
Timeframe : Daily
No result was found by the Central Candlesticks scanner on Japanese candlesticks.
| S3 | S2 | S1 | Price | R1 | |
|---|---|---|---|---|---|
| ProTrendLines | 49.99 | 55.62 | 58.64 | 59.08 | 65.19 |
| Change (%) | -15.39% | -5.86% | -0.74% | - | +10.34% |
| Change | -9.09 | -3.46 | -0.44 | - | +6.11 |
| Level | Major | Major | Intermediate | - | Major |
Pivot points can also be used to set your price objectives. Here is the price situation in relation to pivot points:
| Pivot points | S3 | S2 | S1 | PP | R1 | R2 | R3 |
|---|---|---|---|---|---|---|---|
| Standard | 53.16 | 54.74 | 56.29 | 57.87 | 59.42 | 61.00 | 62.55 |
| Camarilla | 56.99 | 57.28 | 57.56 | 57.85 | 58.14 | 58.42 | 58.71 |
| Woodie | 53.16 | 54.73 | 56.29 | 57.86 | 59.42 | 60.99 | 62.55 |
| Fibonacci | 54.74 | 55.93 | 56.67 | 57.87 | 59.06 | 59.80 | 61.00 |
| Pivot points | S3 | S2 | S1 | PP | R1 | R2 | R3 |
|---|---|---|---|---|---|---|---|
| Standard | 53.78 | 57.15 | 59.70 | 63.07 | 65.62 | 68.99 | 71.54 |
| Camarilla | 60.62 | 61.17 | 61.71 | 62.25 | 62.79 | 63.34 | 63.88 |
| Woodie | 53.37 | 56.95 | 59.29 | 62.87 | 65.21 | 68.79 | 71.13 |
| Fibonacci | 57.15 | 59.41 | 60.81 | 63.07 | 65.33 | 66.73 | 68.99 |
| Pivot points | S3 | S2 | S1 | PP | R1 | R2 | R3 |
|---|---|---|---|---|---|---|---|
| Standard | 41.26 | 47.78 | 52.70 | 59.22 | 64.14 | 70.66 | 75.58 |
| Camarilla | 54.46 | 55.51 | 56.56 | 57.61 | 58.66 | 59.71 | 60.76 |
| Woodie | 40.45 | 47.38 | 51.89 | 58.82 | 63.33 | 70.26 | 74.77 |
| Fibonacci | 47.78 | 52.15 | 54.85 | 59.22 | 63.59 | 66.29 | 70.66 |
Numerical data
The following is the status of the technical indicators and moving averages at the time of publication of this technical analysis:
| RSI (14): | 49.96 | |
| MACD (12,26,9): | 0.8200 | |
| Directional Movement: | 0.41 | |
| AROON (14): | 35.71 | |
| DEMA (21): | 61.15 | |
| Parabolic SAR (0,02-0,02-0,2): | 66.24 | |
| Elder Ray (13): | -1.64 | |
| Super Trend (3,10): | 53.45 | |
| Zig ZAG (10): | 59.08 | |
| VORTEX (21): | 0.9900 | |
| Stochastique (14,3,5): | 33.53 | |
| TEMA (21): | 59.86 | |
| Williams %R (14): | -60.68 | |
| Chande Momentum Oscillator (20): | 3.49 | |
| Repulse (5,40,3): | -4.6600 | |
| ROCnROLL: | -1 | |
| TRIX (15,9): | 0.3100 | |
| Courbe Coppock: | 1.67 |
| MA7: | 60.95 | |
| MA20: | 60.18 | |
| MA50: | 57.09 | |
| MA100: | 48.81 | |
| MAexp7: | 59.85 | |
| MAexp20: | 59.72 | |
| MAexp50: | 56.35 | |
| MAexp100: | 52.00 | |
| Price / MA7: | -3.07% | |
| Price / MA20: | -1.83% | |
| Price / MA50: | +3.49% | |
| Price / MA100: | +21.04% | |
| Price / MAexp7: | -1.29% | |
| Price / MAexp20: | -1.07% | |
| Price / MAexp50: | +4.84% | |
| Price / MAexp100: | +13.62% |
News
Don"t forget to follow the news on ZILLOW GROUP INC.. At the time of publication of this analysis, the latest news was as follows:
- What a Difference a Year Makes: For-Sale Housing Inventory Falls to New Lows With No Signs of Slowing
- Recovery Added $11.3 Trillion to U.S. Housing Value in the 2010s
- Zillow Offers Partners with More Homebuilders to Simplify the Process of Buying a New Home
- There are 218 Million-Dollar Cities in the U.S., But the Stream of New Entrants is Running Dry
- Zillow Offers Expands in Arizona, Now Available In Tucson
About author

Online


Add a comment
Comments
0 comments on the analysis ZILLOW GROUP INC. - Daily