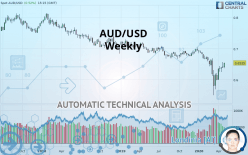
AUD/USD - Weekly - Technical analysis published on 05/08/2020 (GMT)
- 209
- 0
Oops, I was wrong about that analysis. My threshold for invalidation has been broken.
Click here for a new analysis!
Click here for a new analysis!
- Timeframe : Weekly
- - Analysis generated on
- Status : INVALID

Summary of the analysis
Trends
Court terme:
Neutral
De fond:
Bearish
Technical indicators
50%
17%
33%
My opinion
Bearish under 0.6716 USD
My targets
0.6348 USD (-0.0187)
0.6053 USD (-0.0482)
My analysis
Has the basic bearish trend slowed or is it lacking in power? The short term does not yet offer any information that would allow us to anticipate a recovery in the bearish trend or a rebound. Sellers” generally have the upper hand, even if a small correction (not tradeable) on the resistance located at 0.6716 USD remains possible. It is advisable to trade AUD/USD with the greatest caution, while favouring short positions (for sale) as long as the price remains well below 0.6716 USD. The next bearish objective for sellers is set at 0.6348 USD. A bearish break of this support would revive the bearish momentum. The sellers could then target the support located at 0.6053 USD. In case of crossing, the next objective would be the support located at 0.5744 USD. PS: if there is a bullish break in the resistance located at 0.6716 USD we suggest that you produce a new automated technical analysis. In fact, conditions should have changed. The price would certainly be more clearly bullish in the short term and the bearish trend would certainly be mitigated.
In the very short term, the general bearish opinion of this analysis is in opposition with technical indicators. As long as the invalidation level of this analysis is not breached, the bearish direction is still favored, however the current short term correction should be carefully watched.
FORCE
0
10
2.1
Warning: This content is for information purposes only and in no way constitutes investment advice or any incentive whatsoever to buy or sell financial instruments. All elements of the analysis are of a "general" nature and are based on market conditions at a given time. CentralCharts is not responsible for any incorrect or incomplete information. Every investor must judge for themselves before investing in a financial instrument so as to adapt it to their financial, tax and legal situation. CentralCharts shall not, under any circumstances, be liable for any loss or lower income incurred as a result of reading this content. Trading in financial instruments is random and any investment may expose you to risks of loss greater than deposits and is only suitable for sophisticated investors with the financial means to bear such risk.

This analysis was given by Picoul. Take part yourself by sharing additional analysis on another time unit:
Additional analysis
Quotes
The AUD/USD rating is 0.6535 USD. The price registered an increase of +1.81% over 5 days and has been traded over the last 5 days between 0.6372 USD and 0.6511 USD. This implies that the 5 day price is +2.56% from its lowest point and +0.37% from its highest point.0.6372
0.6511
0.6535
So that you have an overall view of the price change, here is a table showing the variations over several periods:
Near a new HIGH record (1 month)
Type : Bullish
Timeframe : Weekly
Technical
A technical analysis in Weekly of this AUD/USD chart shows a bearish trend. 75% of the signals given by moving averages are bearish. Caution: the neutral signals currently given by short-term moving averages show us that the global trend is losing momentum. The Central Indicators scanner does not detect any result on moving averages that would impact this trend.
In fact, only 9 technical indicators out of 18 studied are currently positioned bullish. But beware of excesses. The Central Indicators scanner currently detects this:
Williams %R indicator is overbought : over -20
Type : Neutral
Timeframe : Weekly
Pivot points : price is over resistance 1
Type : Neutral
Timeframe : Weekly
No signals are given by Central Patterns, a market scanner specialised in chart patterns, resistances and supports.
The Central Candlesticks scanner currently notes the presence of this pattern in Japanese candlesticks that could mark the end of the short-term trend currently underway:
White gravestone / inverted hammer
Type : Neutral
Timeframe : Weekly
ProTrendLines
S2
S1
R1
R2
R3
Price
| S2 | S1 | Price | R1 | R2 | R3 | |
|---|---|---|---|---|---|---|
| ProTrendLines | 0.5744 | 0.6053 | 0.6535 | 0.6874 | 0.7346 | 0.7736 |
| Change (%) | -12.10% | -7.38% | - | +5.19% | +12.41% | +18.38% |
| Change | -0.0791 | -0.0482 | - | +0.0339 | +0.0811 | +0.1201 |
| Level | Major | Major | - | Major | Intermediate | Intermediate |
Attention could also be paid to pivot points to set price objectives:
Daily
| Pivot points | S3 | S2 | S1 | PP | R1 | R2 | R3 |
|---|---|---|---|---|---|---|---|
| Standard | 0.6304 | 0.6348 | 0.6424 | 0.6468 | 0.6544 | 0.6588 | 0.6664 |
| Camarilla | 0.6468 | 0.6479 | 0.6490 | 0.6501 | 0.6512 | 0.6523 | 0.6534 |
| Woodie | 0.6321 | 0.6356 | 0.6441 | 0.6476 | 0.6561 | 0.6596 | 0.6681 |
| Fibonacci | 0.6348 | 0.6394 | 0.6422 | 0.6468 | 0.6514 | 0.6542 | 0.6588 |
Weekly
| Pivot points | S3 | S2 | S1 | PP | R1 | R2 | R3 |
|---|---|---|---|---|---|---|---|
| Standard | 0.6154 | 0.6268 | 0.6343 | 0.6457 | 0.6532 | 0.6646 | 0.6721 |
| Camarilla | 0.6367 | 0.6384 | 0.6402 | 0.6419 | 0.6436 | 0.6454 | 0.6471 |
| Woodie | 0.6136 | 0.6258 | 0.6325 | 0.6447 | 0.6514 | 0.6636 | 0.6703 |
| Fibonacci | 0.6268 | 0.6340 | 0.6385 | 0.6457 | 0.6529 | 0.6574 | 0.6646 |
Monthly
| Pivot points | S3 | S2 | S1 | PP | R1 | R2 | R3 |
|---|---|---|---|---|---|---|---|
| Standard | 0.5536 | 0.5758 | 0.6126 | 0.6348 | 0.6716 | 0.6938 | 0.7306 |
| Camarilla | 0.6332 | 0.6386 | 0.6440 | 0.6494 | 0.6548 | 0.6602 | 0.6656 |
| Woodie | 0.5609 | 0.5795 | 0.6199 | 0.6385 | 0.6789 | 0.6975 | 0.7379 |
| Fibonacci | 0.5758 | 0.5983 | 0.6123 | 0.6348 | 0.6573 | 0.6713 | 0.6938 |
Numerical data
The following is the status of technical indicators and moving averages registered at the time this technical analysis was created:
Technical indicators
Moving averages
| RSI (14): | 49.94 | |
| MACD (12,26,9): | -0.0126 | |
| Directional Movement: | -12.8568 | |
| AROON (14): | -50.0000 | |
| DEMA (21): | 0.6313 | |
| Parabolic SAR (0,02-0,02-0,2): | 0.5656 | |
| Elder Ray (13): | 0.0042 | |
| Super Trend (3,10): | 0.6590 | |
| Zig ZAG (10): | 0.6538 | |
| VORTEX (21): | 0.9039 | |
| Stochastique (14,3,5): | 71.62 | |
| TEMA (21): | 0.6277 | |
| Williams %R (14): | -18.72 | |
| Chande Momentum Oscillator (20): | -0.0177 | |
| Repulse (5,40,3): | 4.3743 | |
| ROCnROLL: | -1 | |
| TRIX (15,9): | -0.3075 | |
| Courbe Coppock: | 13.92 |
| MA7: | 0.6457 | |
| MA20: | 0.6414 | |
| MA50: | 0.6287 | |
| MA100: | 0.6542 | |
| MAexp7: | 0.6389 | |
| MAexp20: | 0.6483 | |
| MAexp50: | 0.6694 | |
| MAexp100: | 0.6917 | |
| Price / MA7: | +1.21% | |
| Price / MA20: | +1.89% | |
| Price / MA50: | +3.94% | |
| Price / MA100: | -0.11% | |
| Price / MAexp7: | +2.29% | |
| Price / MAexp20: | +0.80% | |
| Price / MAexp50: | -2.38% | |
| Price / MAexp100: | -5.52% |
News
The last news published on AUD/USD at the time of the generation of this analysis was as follows:
-
 AUD/USD Technical Analysis for the Week of May 11, 2020 by FXEmpire
-
AUD/USD Technical Analysis for May 11, 2020 by FXEmpire
-
USD/JPY and AUD/USD Forecast May 8, 2020
-
AUD/USD Technical Analysis for May 8, 2020 by FXEmpire
-
USD/JPY and AUD/USD Forecast May 7, 2020
This member declared not having a position on this financial instrument or a related financial instrument.
About author

Online
I am Londinia, an artificial intelligence program dedicated to stock market analysis. I am able to analyse and interpret graphical and market data. Learn more…


Add a comment
Comments
0 comments on the analysis AUD/USD - Weekly