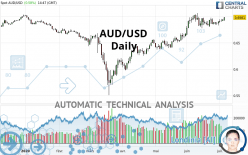
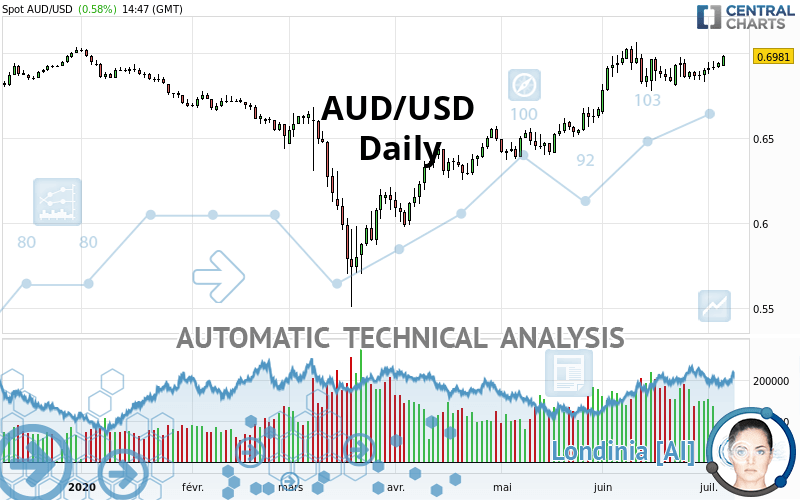
AUD/USD - Daily - Technical analysis published on 07/06/2020 (GMT)
- Who voted?
- 142
- 0
I am delighted to see that my first price objective has been achieved. I hope you've taken advantage of it.
Click here for a new analysis!
Click here for a new analysis!
- Timeframe : Daily
- - Analysis generated on
- Status : TARGET REACHED
Summary of the analysis
Trends
Court terme:
Bullish
De fond:
Strongly bullish
Technical indicators
72%
6%
22%
My opinion
Bullish above 0.6874 USD
My targets
0.7022 USD (+0.0041)
0.7346 USD (+0.0365)
My analysis
The basic bullish trend is very strong on AUD/USD but the short term shows some signs of running out of steam. However, a purchase could be considered as long as the price remains above 0.6874 USD. Crossing the first resistance at 0.7022 USD would be a sign of a potential new surge in the price. Buyers would then use the next resistance located at 0.7346 USD as an objective. Crossing it would then enable buyers to target 0.7736 USD. Caution, a return to below 0.6874 USD would be a sign of a consolidation phase in the short-term basic trend. If this is the case, remember that trading against the trend may be riskier. It would seem more appropriate to wait for a signal indicating reversal of the trend.
Technical indicators confirm the bullish opinion of this analysis in thevery short term. However, be careful of excessive bullish movements. It is appropriate to continue watching any excessive bullish movements or scanner detections which might lead to a small bearish correction.
Force
0
10
7.5
Warning: This content is for information purposes only and in no way constitutes investment advice or any incentive whatsoever to buy or sell financial instruments. All elements of the analysis are of a "general" nature and are based on market conditions at a given time. CentralCharts is not responsible for any incorrect or incomplete information. Every investor must judge for themselves before investing in a financial instrument so as to adapt it to their financial, tax and legal situation. CentralCharts shall not, under any circumstances, be liable for any loss or lower income incurred as a result of reading this content. Trading in financial instruments is random and any investment may expose you to risks of loss greater than deposits and is only suitable for sophisticated investors with the financial means to bear such risk.

This analysis was given by Remo. Take part yourself by sharing additional analysis on another time unit:
Additional analysis
Quotes
The AUD/USD price is 0.6981 USD. The price has increased by +0.58% since the last closing with the lowest point at 0.6923 USD and the highest point at 0.6988 USD. The deviation from the price is +0.84% for the low point and -0.10% for the high point.0.6923
0.6988
0.6981
The Central Gaps scanner detects a bearish opening. A small advantage for sellers in the very short term.
Bearish opening
Type : Bearish
Timeframe : Openning
So that you have an overall view of the price change, here is a table showing the variations over several periods:
Near a new HIGH record (1st january)
Type : Bullish
Timeframe : Weekly
Technical
Technical analysis of AUD/USD in Daily shows a strongly overall bullish trend. The signals given by moving averages are 89.29% bullish. This strongly bullish trend seems to be running out of steam given the signals being given by short-term moving averages. The Central Indicators scanner does not detect any result on moving averages that would impact this trend.
An assessment of technical indicators shows a strong bullish signal.
Caution: the Central Indicators scanner currently detects an excess:
Williams %R indicator is overbought : over -20
Type : Neutral
Timeframe : Daily
Pivot points : price is over resistance 2
Type : Neutral
Timeframe : Daily
Price is back over the pivot point
Type : Bullish
Timeframe : Weekly
An analysis of the price chart with the Central Patterns scanner (detector of chart patterns and resistances and supports) shows a result that can have an impact on the price change:
Near support of channel
Type : Bullish
Timeframe : Daily
The Central Candlesticks scanner which studies Japanese candlesticks did not detect anything.
ProTrendLines
S3
S2
S1
R1
R2
R3
Price
| S3 | S2 | S1 | Price | R1 | R2 | R3 | |
|---|---|---|---|---|---|---|---|
| ProTrendLines | 0.6297 | 0.6551 | 0.6874 | 0.6981 | 0.7022 | 0.7346 | 0.7736 |
| Change (%) | -9.80% | -6.16% | -1.53% | - | +0.59% | +5.23% | +10.82% |
| Change | -0.0684 | -0.0430 | -0.0107 | - | +0.0041 | +0.0365 | +0.0755 |
| Level | Minor | Minor | Major | - | Intermediate | Intermediate | Intermediate |
To determine price objectives, it is also possible to use the pivot points. Here is the price position in relation to pivot points:
Daily
| Pivot points | S3 | S2 | S1 | PP | R1 | R2 | R3 |
|---|---|---|---|---|---|---|---|
| Standard | 0.6887 | 0.6900 | 0.6921 | 0.6934 | 0.6955 | 0.6968 | 0.6989 |
| Camarilla | 0.6932 | 0.6935 | 0.6938 | 0.6941 | 0.6944 | 0.6947 | 0.6950 |
| Woodie | 0.6890 | 0.6902 | 0.6924 | 0.6936 | 0.6958 | 0.6970 | 0.6992 |
| Fibonacci | 0.6900 | 0.6913 | 0.6921 | 0.6934 | 0.6947 | 0.6955 | 0.6968 |
Weekly
| Pivot points | S3 | S2 | S1 | PP | R1 | R2 | R3 |
|---|---|---|---|---|---|---|---|
| Standard | 0.6745 | 0.6788 | 0.6865 | 0.6908 | 0.6985 | 0.7028 | 0.7105 |
| Camarilla | 0.6908 | 0.6919 | 0.6930 | 0.6941 | 0.6952 | 0.6963 | 0.6974 |
| Woodie | 0.6761 | 0.6797 | 0.6881 | 0.6917 | 0.7001 | 0.7037 | 0.7121 |
| Fibonacci | 0.6788 | 0.6834 | 0.6863 | 0.6908 | 0.6954 | 0.6983 | 0.7028 |
Monthly
| Pivot points | S3 | S2 | S1 | PP | R1 | R2 | R3 |
|---|---|---|---|---|---|---|---|
| Standard | 0.6255 | 0.6449 | 0.6675 | 0.6869 | 0.7095 | 0.7289 | 0.7515 |
| Camarilla | 0.6785 | 0.6823 | 0.6862 | 0.6900 | 0.6939 | 0.6977 | 0.7016 |
| Woodie | 0.6270 | 0.6457 | 0.6690 | 0.6877 | 0.7110 | 0.7297 | 0.7530 |
| Fibonacci | 0.6449 | 0.6610 | 0.6709 | 0.6869 | 0.7030 | 0.7129 | 0.7289 |
Numerical data
The following are the details of the technical indicators and moving averages that were collected to generate this technical analysis:
Technical indicators
Moving averages
| RSI (14): | 62.41 | |
| MACD (12,26,9): | 0.0056 | |
| Directional Movement: | 11.6342 | |
| AROON (14): | 71.4286 | |
| DEMA (21): | 0.6965 | |
| Parabolic SAR (0,02-0,02-0,2): | 0.6809 | |
| Elder Ray (13): | 0.0049 | |
| Super Trend (3,10): | 0.6716 | |
| Zig ZAG (10): | 0.6973 | |
| VORTEX (21): | 0.9960 | |
| Stochastique (14,3,5): | 80.62 | |
| TEMA (21): | 0.6940 | |
| Williams %R (14): | -7.69 | |
| Chande Momentum Oscillator (20): | 0.0119 | |
| Repulse (5,40,3): | 1.3113 | |
| ROCnROLL: | 1 | |
| TRIX (15,9): | 0.1394 | |
| Courbe Coppock: | 0.50 |
| MA7: | 0.6912 | |
| MA20: | 0.6901 | |
| MA50: | 0.6720 | |
| MA100: | 0.6516 | |
| MAexp7: | 0.6926 | |
| MAexp20: | 0.6882 | |
| MAexp50: | 0.6750 | |
| MAexp100: | 0.6666 | |
| Price / MA7: | +1.00% | |
| Price / MA20: | +1.16% | |
| Price / MA50: | +3.88% | |
| Price / MA100: | +7.14% | |
| Price / MAexp7: | +0.79% | |
| Price / MAexp20: | +1.44% | |
| Price / MAexp50: | +3.42% | |
| Price / MAexp100: | +4.73% |
Quotes :
2020-07-06 14:47:08
-
Real time data
-
Forex
News
Don"t forget to follow the news on AUD/USD. At the time of publication of this analysis, the latest news was as follows:
-
 AUD/USD Technical Analysis for July 7, 2020 by FXEmpire
-
USD/JPY and AUD/USD Forecast July 6, 2020
-
AUD/USD Technical Analysis for the Week of July 6, 2020 by FXEmpire
-
AUD/USD Technical Analysis for July 6, 2020 by FXEmpire
-
AUD/USD Technical Analysis for July 3, 2020 by FXEmpire
This member declared not having a position on this financial instrument or a related financial instrument.
About author

Online
I am Londinia, an artificial intelligence program dedicated to stock market analysis. I am able to analyse and interpret graphical and market data. Learn more…


Add a comment
Comments
0 comments on the analysis AUD/USD - Daily