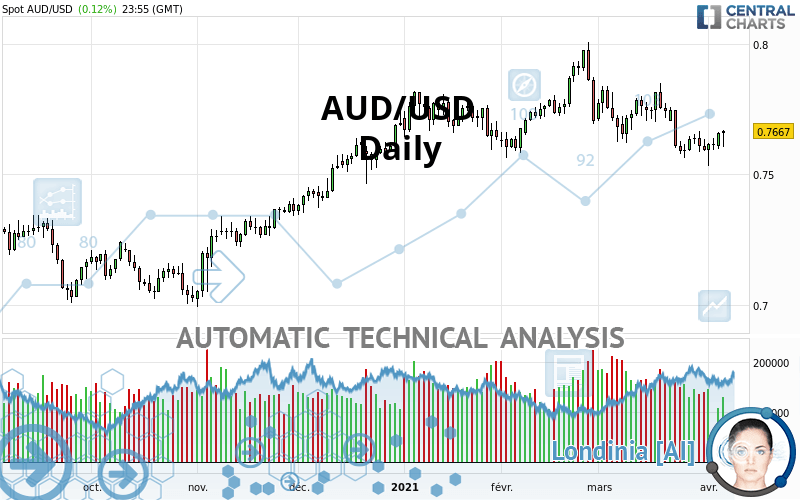
AUD/USD - Daily - Technical analysis published on 04/06/2021 (GMT)
- 182
- 0
Click here for a new analysis!
- Timeframe : Daily
- - Analysis generated on
- Status : TARGET REACHED

Summary of the analysis

Additional analysis
Quotes
The AUD/USD rating is 0.7667 USD. The price registered an increase of +0.12% on the session and was between 0.7606 USD and 0.7669 USD. This implies that the price is at +0.80% from its lowest and at -0.03% from its highest.The Central Gaps scanner detects a bearish opening. A small advantage for sellers in the very short term.
Bearish opening
Type : Bearish
Timeframe : Openning
So that you have an overall view of the price change, here is a table showing the variations over several periods:
Technical
A technical analysis in Daily of this AUD/USD chart shows a neutral trend. This indecision could turn into a bearish trend due to the strong bearish signals currently being given by short-term moving averages. The Central Indicators scanner detects a bullish signal on moving averages that could impact this trend:
Bullish price crossover with Moving Average 100
Type : Bullish
Timeframe : Daily
In fact, Central Analyzer took into account 18 technical indicators and the result was as follows: 6 are bullish, 6 are neutral and 6 are bearish. But beware of excesses. The Central Indicators scanner currently detects this:
CCI indicator: bullish divergence
Type : Bullish
Timeframe : Daily
MACD indicator: bullish divergence
Type : Bullish
Timeframe : Daily
RSI indicator: bullish divergence
Type : Bullish
Timeframe : Daily
Williams %R indicator is overbought : over -20
Type : Neutral
Timeframe : Daily
Pivot points : price is over resistance 1
Type : Neutral
Timeframe : Weekly
Pivot points : price is over resistance 3
Type : Neutral
Timeframe : Daily
Pivot points : price is under support 3
Type : Neutral
Timeframe : Daily
Pivot points : price is under support 3
Type : Neutral
Timeframe : Weekly
An analysis of the price chart with the Central Patterns scanner (detector of chart patterns and resistances and supports) shows a result that can have an impact on the price change:
Near support of triangle
Type : Bullish
Timeframe : Daily
Central Candlesticks, the scanner specialised in Japanese candlesticks, detects a bullish signal that could support the hypothesis of a small rebound in the very short term:
Bullish engulfing lines
Type : Bullish
Timeframe : Daily
| S3 | S2 | S1 | Price | R1 | R2 | R3 | |
|---|---|---|---|---|---|---|---|
| ProTrendLines | 0.7246 | 0.7364 | 0.7596 | 0.7667 | 0.7820 | 0.7976 | 0.8110 |
| Change (%) | -5.49% | -3.95% | -0.93% | - | +2.00% | +4.03% | +5.78% |
| Change | -0.0421 | -0.0303 | -0.0071 | - | +0.0153 | +0.0309 | +0.0443 |
| Level | Minor | Major | Intermediate | - | Intermediate | Minor | Major |
Attention could also be paid to pivot points to set price objectives:
| Pivot points | S3 | S2 | S1 | PP | R1 | R2 | R3 |
|---|---|---|---|---|---|---|---|
| Standard | 0.7554 | 0.7576 | 0.7617 | 0.7639 | 0.7680 | 0.7702 | 0.7743 |
| Camarilla | 0.7641 | 0.7647 | 0.7652 | 0.7658 | 0.7664 | 0.7670 | 0.7675 |
| Woodie | 0.7564 | 0.7581 | 0.7627 | 0.7644 | 0.7690 | 0.7707 | 0.7753 |
| Fibonacci | 0.7576 | 0.7600 | 0.7615 | 0.7639 | 0.7663 | 0.7678 | 0.7702 |
| Pivot points | S3 | S2 | S1 | PP | R1 | R2 | R3 |
|---|---|---|---|---|---|---|---|
| Standard | 0.7409 | 0.7471 | 0.7541 | 0.7603 | 0.7673 | 0.7735 | 0.7805 |
| Camarilla | 0.7576 | 0.7588 | 0.7600 | 0.7612 | 0.7624 | 0.7636 | 0.7648 |
| Woodie | 0.7414 | 0.7473 | 0.7546 | 0.7605 | 0.7678 | 0.7737 | 0.7810 |
| Fibonacci | 0.7471 | 0.7521 | 0.7552 | 0.7603 | 0.7653 | 0.7684 | 0.7735 |
| Pivot points | S3 | S2 | S1 | PP | R1 | R2 | R3 |
|---|---|---|---|---|---|---|---|
| Standard | 0.7201 | 0.7382 | 0.7488 | 0.7669 | 0.7775 | 0.7956 | 0.8062 |
| Camarilla | 0.7515 | 0.7541 | 0.7568 | 0.7594 | 0.7620 | 0.7647 | 0.7673 |
| Woodie | 0.7164 | 0.7363 | 0.7451 | 0.7650 | 0.7738 | 0.7937 | 0.8025 |
| Fibonacci | 0.7382 | 0.7492 | 0.7559 | 0.7669 | 0.7779 | 0.7846 | 0.7956 |
Numerical data
The following are the details of the technical indicators and moving averages that were collected to generate this technical analysis:
| RSI (14): | 48.00 | |
| MACD (12,26,9): | -0.0031 | |
| Directional Movement: | -6.2762 | |
| AROON (14): | -71.4285 | |
| DEMA (21): | 0.7630 | |
| Parabolic SAR (0,02-0,02-0,2): | 0.7711 | |
| Elder Ray (13): | -0.0014 | |
| Super Trend (3,10): | 0.7798 | |
| Zig ZAG (10): | 0.7666 | |
| VORTEX (21): | 0.9801 | |
| Stochastique (14,3,5): | 35.64 | |
| TEMA (21): | 0.7606 | |
| Williams %R (14): | -57.55 | |
| Chande Momentum Oscillator (20): | -0.0076 | |
| Repulse (5,40,3): | 1.2836 | |
| ROCnROLL: | -1 | |
| TRIX (15,9): | -0.0597 | |
| Courbe Coppock: | 3.23 |
| MA7: | 0.7627 | |
| MA20: | 0.7682 | |
| MA50: | 0.7717 | |
| MA100: | 0.7638 | |
| MAexp7: | 0.7639 | |
| MAexp20: | 0.7668 | |
| MAexp50: | 0.7683 | |
| MAexp100: | 0.7601 | |
| Price / MA7: | +0.52% | |
| Price / MA20: | -0.20% | |
| Price / MA50: | -0.65% | |
| Price / MA100: | +0.38% | |
| Price / MAexp7: | +0.37% | |
| Price / MAexp20: | -0.01% | |
| Price / MAexp50: | -0.21% | |
| Price / MAexp100: | +0.87% |
News
Don"t forget to follow the news on AUD/USD. At the time of publication of this analysis, the latest news was as follows:
-
 AUD/USD Technical Analysis for April 7, 2021 by FXEmpire
-
AUD/USD Daily Forecast - U.S. Dollar Rebounds After Yesterday's Sell-Off
-
AUD/USD Technical Analysis for April 6, 2021 by FXEmpire
-
AUD/USD Daily Forecast - Another Test Of Support At 0.7600 Yielded No Results
-
AUD/USD Technical Analysis for the Week of April 5, 2021 by FXEmpire
About author

Online


Add a comment
Comments
0 comments on the analysis AUD/USD - Daily