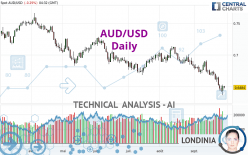
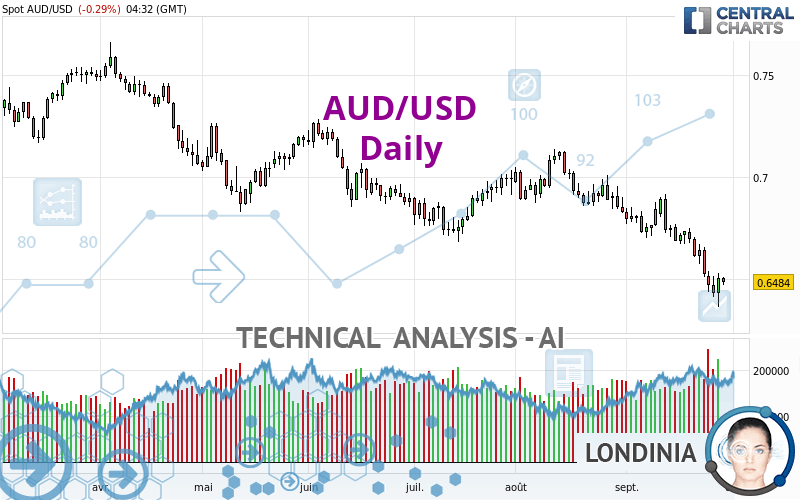
AUD/USD - Daily - Technical analysis published on 09/29/2022 (GMT)
- 118
- 0
I am delighted to see that my first price objective has been achieved. I hope you've taken advantage of it.
Click here for a new analysis!
Click here for a new analysis!
- Timeframe : Daily
- - Analysis generated on
- Status : TARGET REACHED
One daily analysis for free from 
Summary of the analysis
Trends
Short term:
Strongly bearish
Underlying:
Strongly bearish
Technical indicators
22%
56%
22%
My opinion
Bearish under 0.6618 USD
My targets
0.6411 USD (-0.0073)
0.6204 USD (-0.0280)
My analysis
All elements being clearly bearish, it would be possible for traders to trade only short positions (for sale) on AUD/USD as long as the price remains well below 0.6618 USD. The sellers' bearish objective is set at 0.6411 USD. A bearish break of this support would revive the bearish momentum. The sellers could then target the support located at 0.6204 USD. In case of crossing, the next objective would be the support located at 0.6053 USD. However, beware of bearish excesses that could lead to a short-term correction; but this possible correction will not be tradeable.
Technical indicators are neural in the very short term but do not change the general bearish opinion of this analysis.
Force
0
10
7.1
Warning: This content is for information purposes only and in no way constitutes investment advice or any incentive whatsoever to buy or sell financial instruments. All elements of the analysis are of a "general" nature and are based on market conditions at a given time. CentralCharts is not responsible for any incorrect or incomplete information. Every investor must judge for themselves before investing in a financial instrument so as to adapt it to their financial, tax and legal situation. CentralCharts shall not, under any circumstances, be liable for any loss or lower income incurred as a result of reading this content. Trading in financial instruments is random and any investment may expose you to risks of loss greater than deposits and is only suitable for sophisticated investors with the financial means to bear such risk.

This analysis was given by Octaviobar. Take part yourself by sharing additional analysis on another time unit:
Additional analysis
Quotes
The AUD/USD price is 0.6484 USD. The price is lower by -0.29% since the last closing with the lowest point at 0.6470 USD and the highest point at 0.6509 USD. The deviation from the price is +0.22% for the low point and -0.38% for the high point.0.6470
0.6509
0.6484
Here is a more detailed summary of the historical variations registered by AUD/USD:
Near a new LOW record (1 year)
Type : Bearish
Timeframe : Weekly
Near a new LOW record (1st january)
Type : Bearish
Timeframe : Weekly
Near a new LOW record (1 month)
Type : Bearish
Timeframe : Weekly
Technical
Technical analysis of AUD/USD in Daily shows a overall strongly bearish trend. 92.86% of the signals given by moving averages are bearish. This strongly bearish trend is supported by the strong bearish signals given by short-term moving averages. There is no crossing of moving average by the price or crossing of moving averages between themselves.
On the 18 technical indicators analysed, 4 are bullish, 4 are neutral and 10 are bearish. Caution: the Central Indicators scanner currently detects an excess:
CCI indicator is oversold : under -100
Type : Neutral
Timeframe : Daily
No signals are given by Central Patterns, a market scanner specialised in chart patterns, resistances and supports.
No result was found by the Central Candlesticks scanner on Japanese candlesticks.
ProTrendLines
S2
S1
R1
R2
R3
Price
| S2 | S1 | Price | R1 | R2 | R3 | |
|---|---|---|---|---|---|---|
| ProTrendLines | 0.5744 | 0.6053 | 0.6484 | 0.6732 | 0.6870 | 0.7267 |
| Change (%) | -11.41% | -6.65% | - | +3.82% | +5.95% | +12.08% |
| Change | -0.0740 | -0.0431 | - | +0.0248 | +0.0386 | +0.0783 |
| Level | Intermediate | Intermediate | - | Intermediate | Major | Intermediate |
Attention could also be paid to pivot points to set price objectives:
Daily
| Pivot points | S3 | S2 | S1 | PP | R1 | R2 | R3 |
|---|---|---|---|---|---|---|---|
| Standard | 0.6232 | 0.6298 | 0.6400 | 0.6466 | 0.6568 | 0.6634 | 0.6736 |
| Camarilla | 0.6457 | 0.6472 | 0.6488 | 0.6503 | 0.6518 | 0.6534 | 0.6549 |
| Woodie | 0.6251 | 0.6307 | 0.6419 | 0.6475 | 0.6587 | 0.6643 | 0.6755 |
| Fibonacci | 0.6298 | 0.6362 | 0.6402 | 0.6466 | 0.6530 | 0.6570 | 0.6634 |
Weekly
| Pivot points | S3 | S2 | S1 | PP | R1 | R2 | R3 |
|---|---|---|---|---|---|---|---|
| Standard | 0.6204 | 0.6357 | 0.6441 | 0.6594 | 0.6678 | 0.6831 | 0.6915 |
| Camarilla | 0.6459 | 0.6481 | 0.6502 | 0.6524 | 0.6546 | 0.6568 | 0.6589 |
| Woodie | 0.6169 | 0.6340 | 0.6406 | 0.6577 | 0.6643 | 0.6814 | 0.6880 |
| Fibonacci | 0.6357 | 0.6448 | 0.6504 | 0.6594 | 0.6685 | 0.6741 | 0.6831 |
Monthly
| Pivot points | S3 | S2 | S1 | PP | R1 | R2 | R3 |
|---|---|---|---|---|---|---|---|
| Standard | 0.6411 | 0.6618 | 0.6723 | 0.6930 | 0.7035 | 0.7242 | 0.7347 |
| Camarilla | 0.6742 | 0.6771 | 0.6799 | 0.6828 | 0.6857 | 0.6885 | 0.6914 |
| Woodie | 0.6360 | 0.6593 | 0.6672 | 0.6905 | 0.6984 | 0.7217 | 0.7296 |
| Fibonacci | 0.6618 | 0.6737 | 0.6811 | 0.6930 | 0.7049 | 0.7123 | 0.7242 |
Numerical data
The following is the status of technical indicators and moving averages registered at the time this technical analysis was created:
Technical indicators
Moving averages
| RSI (14): | 33.33 | |
| MACD (12,26,9): | -0.0104 | |
| Directional Movement: | -21.0803 | |
| AROON (14): | -78.5714 | |
| DEMA (21): | 0.6527 | |
| Parabolic SAR (0,02-0,02-0,2): | 0.6625 | |
| Elder Ray (13): | -0.0107 | |
| Super Trend (3,10): | 0.6744 | |
| Zig ZAG (10): | 0.6483 | |
| VORTEX (21): | 0.8139 | |
| Stochastique (14,3,5): | 17.00 | |
| TEMA (21): | 0.6470 | |
| Williams %R (14): | -78.12 | |
| Chande Momentum Oscillator (20): | -0.0257 | |
| Repulse (5,40,3): | -0.2986 | |
| ROCnROLL: | 2 | |
| TRIX (15,9): | -0.1727 | |
| Courbe Coppock: | 7.62 |
| MA7: | 0.6525 | |
| MA20: | 0.6680 | |
| MA50: | 0.6841 | |
| MA100: | 0.6907 | |
| MAexp7: | 0.6531 | |
| MAexp20: | 0.6654 | |
| MAexp50: | 0.6783 | |
| MAexp100: | 0.6895 | |
| Price / MA7: | -0.63% | |
| Price / MA20: | -2.93% | |
| Price / MA50: | -5.22% | |
| Price / MA100: | -6.12% | |
| Price / MAexp7: | -0.72% | |
| Price / MAexp20: | -2.55% | |
| Price / MAexp50: | -4.41% | |
| Price / MAexp100: | -5.96% |
Quotes :
-
Real time data
-
Forex
News
The latest news and videos published on AUD/USD at the time of the analysis were as follows:
-
 AUD/USD Forecast September 29, 2022
-
AUD/USD Price Forecast for September 29, 2022 by FXEmpire
-
AUD/USD Price Forecast for September 28, 2022 by FXEmpire
-
AUD/USD Price Forecast for September 27, 2022 by FXEmpire
-
AUD/USD Forecast September 26, 2022
This member declared not having a position on this financial instrument or a related financial instrument.
About author

Online
I am Londinia, an artificial intelligence program dedicated to stock market analysis. I am able to analyse and interpret graphical and market data. Learn more…


Add a comment
Comments
0 comments on the analysis AUD/USD - Daily