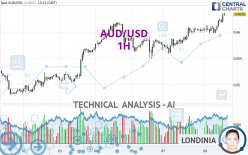
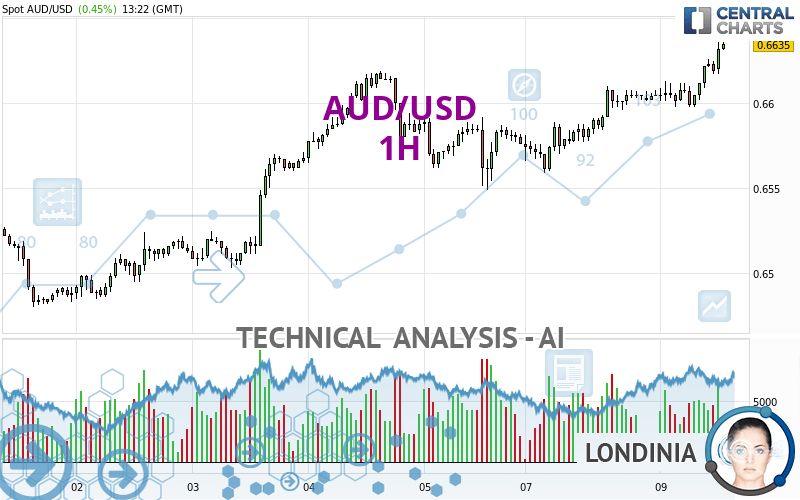
AUD/USD - 1H - Technical analysis published on 04/09/2024 (GMT)
- 52
- 0
Click here for a new analysis!
- Timeframe : 1H
- - Analysis generated on
- Status : INVALID
Summary of the analysis

Additional analysis
Quotes
AUD/USD rating 0.6635 USD. The price registered an increase of +0.45% on the session and was between 0.6598 USD and 0.6636 USD. This implies that the price is at +0.56% from its lowest and at -0.02% from its highest.A study of price movements over other periods shows the following variations:
Near a new LOW record (1 year)
Type : Bearish
Timeframe : Weekly
Near a new HIGH record (1st january)
Type : Bullish
Timeframe : Weekly
Near a new LOW record (1 month)
Type : Bearish
Timeframe : Weekly
Technical
Technical analysis of this 1H chart of AUD/USD indicates that the overall trend is strongly bullish. 92.86% of the signals given by moving averages are bullish. The overall trend is supported by the strong bullish signals from short-term moving averages. The Central Indicators market scanner currently does not detect any result that concerns moving averages.
The probability of a further increase is high given the direction of the technical indicators.
Caution: the Central Indicators scanner currently detects an excess:
RSI indicator is overbought : over 70
Type : Neutral
Timeframe : 1 hour
CCI indicator is overbought : over 100
Type : Neutral
Timeframe : 1 hour
Previous candle closed over Bollinger bands
Type : Neutral
Timeframe : 1 hour
CCI indicator: bearish divergence
Type : Bearish
Timeframe : 1 hour
Williams %R indicator is overbought : over -20
Type : Neutral
Timeframe : 1 hour
Pivot points : price is over resistance 1
Type : Neutral
Timeframe : 1 hour
Central Patterns, the market scanner focusing on chart patterns, resistances and supports found these results:
Near horizontal resistance
Type : Bearish
Timeframe : 1 hour
Resistance of channel is broken
Type : Bullish
Timeframe : 1 hour
Central Candlesticks, the scanner specialised in Japanese candlesticks, detects this inversion signal that could impact the current short-term trend:
Doji
Type : Neutral
Timeframe : 1 hour
| S3 | S2 | S1 | Price | R1 | R2 | R3 | |
|---|---|---|---|---|---|---|---|
| ProTrendLines | 0.6592 | 0.6619 | 0.6633 | 0.6635 | 0.6730 | 0.6787 | 0.6878 |
| Change (%) | -0.65% | -0.24% | -0.03% | - | +1.43% | +2.29% | +3.66% |
| Change | -0.0043 | -0.0016 | -0.0002 | - | +0.0095 | +0.0152 | +0.0243 |
| Level | Minor | Intermediate | Major | - | Minor | Minor | Major |
Pivot points can also be used to set your price objectives. Here is the price situation in relation to pivot points:
| Pivot points | S3 | S2 | S1 | PP | R1 | R2 | R3 |
|---|---|---|---|---|---|---|---|
| Standard | 0.6522 | 0.6540 | 0.6573 | 0.6591 | 0.6624 | 0.6642 | 0.6675 |
| Camarilla | 0.6591 | 0.6596 | 0.6600 | 0.6605 | 0.6610 | 0.6614 | 0.6619 |
| Woodie | 0.6529 | 0.6544 | 0.6580 | 0.6595 | 0.6631 | 0.6646 | 0.6682 |
| Fibonacci | 0.6540 | 0.6560 | 0.6572 | 0.6591 | 0.6611 | 0.6623 | 0.6642 |
| Pivot points | S3 | S2 | S1 | PP | R1 | R2 | R3 |
|---|---|---|---|---|---|---|---|
| Standard | 0.6359 | 0.6419 | 0.6498 | 0.6558 | 0.6637 | 0.6697 | 0.6776 |
| Camarilla | 0.6538 | 0.6551 | 0.6563 | 0.6576 | 0.6589 | 0.6602 | 0.6614 |
| Woodie | 0.6368 | 0.6424 | 0.6507 | 0.6563 | 0.6646 | 0.6702 | 0.6785 |
| Fibonacci | 0.6419 | 0.6472 | 0.6505 | 0.6558 | 0.6611 | 0.6644 | 0.6697 |
| Pivot points | S3 | S2 | S1 | PP | R1 | R2 | R3 |
|---|---|---|---|---|---|---|---|
| Standard | 0.6249 | 0.6363 | 0.6439 | 0.6553 | 0.6629 | 0.6743 | 0.6819 |
| Camarilla | 0.6462 | 0.6479 | 0.6497 | 0.6514 | 0.6531 | 0.6549 | 0.6566 |
| Woodie | 0.6229 | 0.6354 | 0.6419 | 0.6544 | 0.6609 | 0.6734 | 0.6799 |
| Fibonacci | 0.6363 | 0.6436 | 0.6481 | 0.6553 | 0.6626 | 0.6671 | 0.6743 |
Numerical data
The following is the status of technical indicators and moving averages registered at the time this technical analysis was created:
| RSI (14): | 71.53 | |
| MACD (12,26,9): | 0.0009 | |
| Directional Movement: | 20.3508 | |
| AROON (14): | 64.2857 | |
| DEMA (21): | 0.6623 | |
| Parabolic SAR (0,02-0,02-0,2): | 0.6603 | |
| Elder Ray (13): | 0.0017 | |
| Super Trend (3,10): | 0.6606 | |
| Zig ZAG (10): | 0.6631 | |
| VORTEX (21): | 1.2108 | |
| Stochastique (14,3,5): | 85.53 | |
| TEMA (21): | 0.6627 | |
| Williams %R (14): | -5.26 | |
| Chande Momentum Oscillator (20): | 0.0028 | |
| Repulse (5,40,3): | 0.2263 | |
| ROCnROLL: | 1 | |
| TRIX (15,9): | 0.0153 | |
| Courbe Coppock: | 0.52 |
| MA7: | 0.6568 | |
| MA20: | 0.6556 | |
| MA50: | 0.6545 | |
| MA100: | 0.6599 | |
| MAexp7: | 0.6623 | |
| MAexp20: | 0.6611 | |
| MAexp50: | 0.6598 | |
| MAexp100: | 0.6583 | |
| Price / MA7: | +1.02% | |
| Price / MA20: | +1.21% | |
| Price / MA50: | +1.38% | |
| Price / MA100: | +0.55% | |
| Price / MAexp7: | +0.18% | |
| Price / MAexp20: | +0.36% | |
| Price / MAexp50: | +0.56% | |
| Price / MAexp100: | +0.79% |
News
The latest news and videos published on AUD/USD at the time of the analysis were as follows:
-
 AUD/USD Daily Forecast and Technical Analysis for April 09, 2024, by Chris Lewis for FX Empire
-
AUD/USD Daily Forecast and Technical Analysis for April 08, 2024, by Chris Lewis for FX Empire
-
AUD/USD Forecast April 8, 2024
-
AUD/USD Long Term Forecast and Technical Analysis for April 05, 2024, by Chris Lewis for FX Empire
-
AUD/USD Daily Forecast and Technical Analysis for April 05, 2024, by Chris Lewis for FX Empire
About author

Online


Add a comment
Comments
0 comments on the analysis AUD/USD - 1H