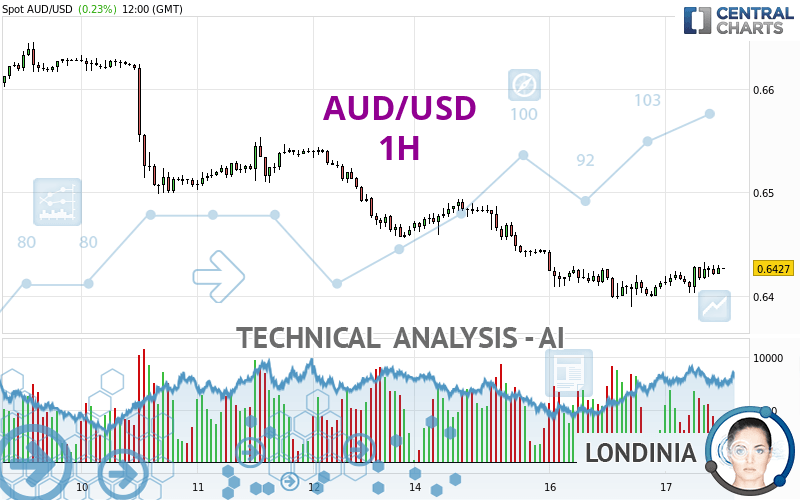
AUD/USD - 1H - Technical analysis published on 04/17/2024 (GMT)
- 69
- 0
Click here for a new analysis!
- Timeframe : 1H
- - Analysis generated on
- Status : INVALID

Summary of the analysis

Additional analysis
Quotes
The AUD/USD price is 0.6427 USD. The price has increased by +0.23% since the last closing with the lowest point at 0.6403 USD and the highest point at 0.6432 USD. The deviation from the price is +0.37% for the low point and -0.08% for the high point.So that you have an overall view of the price change, here is a table showing the variations over several periods:
Near a new LOW record (1 year)
Type : Bearish
Timeframe : Weekly
Near a new LOW record (1st january)
Type : Bearish
Timeframe : Weekly
Near a new HIGH record (1 month)
Type : Bullish
Timeframe : Weekly
Technical
Technical analysis of AUD/USD in 1H shows an overall bearish trend. 67.86% of the signals given by moving averages are bearish. Caution: as the signals currently given by short-term moving averages are rather neutral, the bearish trend could slow down. The Central Indicators scanner detects bullish signals on moving averages that could impact this trend:
Bullish price crossover with Moving Average 50
Type : Bullish
Timeframe : 1 hour
Bullish price crossover with adaptative moving average 100
Type : Bullish
Timeframe : 1 hour
In fact, according to the parameters integrated into the Central Analyzer system, 12 technical indicators out of 18 analysed are currently bullish. Caution: the Central Indicators scanner currently detects an excess:
CCI indicator is overbought : over 100
Type : Neutral
Timeframe : 1 hour
Williams %R indicator is overbought : over -20
Type : Neutral
Timeframe : 1 hour
MACD indicator is back over 0
Type : Bullish
Timeframe : 1 hour
The Central Patterns scanner, which studies chart patterns, resistances and supports, has identified these signals:
Near horizontal resistance
Type : Bearish
Timeframe : 1 hour
Resistance of channel is broken
Type : Bullish
Timeframe : 1 hour
No result was found by the Central Candlesticks scanner on Japanese candlesticks.
| S3 | S2 | S1 | Price | R1 | R2 | R3 | |
|---|---|---|---|---|---|---|---|
| ProTrendLines | 0.6294 | 0.6374 | 0.6408 | 0.6427 | 0.6453 | 0.6498 | 0.6552 |
| Change (%) | -2.07% | -0.82% | -0.30% | - | +0.40% | +1.10% | +1.94% |
| Change | -0.0133 | -0.0053 | -0.0019 | - | +0.0026 | +0.0071 | +0.0125 |
| Level | Major | Minor | Intermediate | - | Major | Intermediate | Intermediate |
Pivot points can also be used to set your price objectives. Here is the price situation in relation to pivot points:
| Pivot points | S3 | S2 | S1 | PP | R1 | R2 | R3 |
|---|---|---|---|---|---|---|---|
| Standard | 0.6331 | 0.6360 | 0.6386 | 0.6415 | 0.6441 | 0.6470 | 0.6496 |
| Camarilla | 0.6397 | 0.6402 | 0.6407 | 0.6412 | 0.6417 | 0.6422 | 0.6427 |
| Woodie | 0.6330 | 0.6359 | 0.6385 | 0.6414 | 0.6440 | 0.6469 | 0.6495 |
| Fibonacci | 0.6360 | 0.6381 | 0.6394 | 0.6415 | 0.6436 | 0.6449 | 0.6470 |
| Pivot points | S3 | S2 | S1 | PP | R1 | R2 | R3 |
|---|---|---|---|---|---|---|---|
| Standard | 0.6209 | 0.6332 | 0.6398 | 0.6521 | 0.6587 | 0.6710 | 0.6776 |
| Camarilla | 0.6411 | 0.6428 | 0.6446 | 0.6463 | 0.6480 | 0.6498 | 0.6515 |
| Woodie | 0.6180 | 0.6318 | 0.6369 | 0.6507 | 0.6558 | 0.6696 | 0.6747 |
| Fibonacci | 0.6332 | 0.6405 | 0.6449 | 0.6521 | 0.6594 | 0.6638 | 0.6710 |
| Pivot points | S3 | S2 | S1 | PP | R1 | R2 | R3 |
|---|---|---|---|---|---|---|---|
| Standard | 0.6249 | 0.6363 | 0.6439 | 0.6553 | 0.6629 | 0.6743 | 0.6819 |
| Camarilla | 0.6462 | 0.6479 | 0.6497 | 0.6514 | 0.6531 | 0.6549 | 0.6566 |
| Woodie | 0.6229 | 0.6354 | 0.6419 | 0.6544 | 0.6609 | 0.6734 | 0.6799 |
| Fibonacci | 0.6363 | 0.6436 | 0.6481 | 0.6553 | 0.6626 | 0.6671 | 0.6743 |
Numerical data
The following are the details of the technical indicators and moving averages that were collected to generate this technical analysis:
| RSI (14): | 54.68 | |
| MACD (12,26,9): | 0.0000 | |
| Directional Movement: | 3.9737 | |
| AROON (14): | 78.5714 | |
| DEMA (21): | 0.6417 | |
| Parabolic SAR (0,02-0,02-0,2): | 0.6411 | |
| Elder Ray (13): | 0.0007 | |
| Super Trend (3,10): | 0.6438 | |
| Zig ZAG (10): | 0.6427 | |
| VORTEX (21): | 1.0968 | |
| Stochastique (14,3,5): | 76.61 | |
| TEMA (21): | 0.6425 | |
| Williams %R (14): | -15.63 | |
| Chande Momentum Oscillator (20): | 0.0015 | |
| Repulse (5,40,3): | 0.0565 | |
| ROCnROLL: | -1 | |
| TRIX (15,9): | -0.0060 | |
| Courbe Coppock: | 0.48 |
| MA7: | 0.6488 | |
| MA20: | 0.6523 | |
| MA50: | 0.6538 | |
| MA100: | 0.6593 | |
| MAexp7: | 0.6422 | |
| MAexp20: | 0.6419 | |
| MAexp50: | 0.6431 | |
| MAexp100: | 0.6460 | |
| Price / MA7: | -0.94% | |
| Price / MA20: | -1.47% | |
| Price / MA50: | -1.70% | |
| Price / MA100: | -2.52% | |
| Price / MAexp7: | +0.08% | |
| Price / MAexp20: | +0.12% | |
| Price / MAexp50: | -0.06% | |
| Price / MAexp100: | -0.51% |
News
The latest news and videos published on AUD/USD at the time of the analysis were as follows:
-
 AUD/USD Daily Forecast and Technical Analysis for April 16, 2024, by Chris Lewis for FX Empire
-
AUD/USD Daily Forecast and Technical Analysis for April 15, 2024, by Chris Lewis for FX Empire
-
Weekly Technical Outlook: 15/04/2024 - GBPUSD, USDJPY, AUDUSD
-
AUD/USD Forecast April 15, 2024
-
AUD/USD Long Term Forecast and Technical Analysis for April 12, 2024, by Chris Lewis for FX Empire
About author

Online


Add a comment
Comments
0 comments on the analysis AUD/USD - 1H