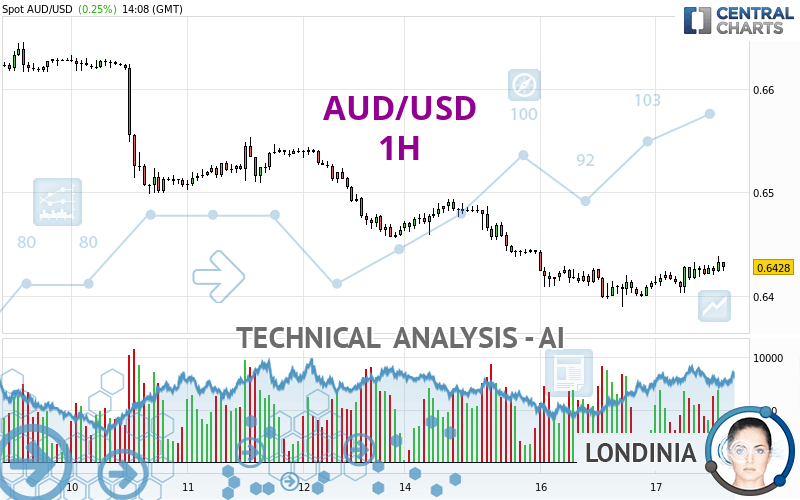
AUD/USD - 1H - Technical analysis published on 04/17/2024 (GMT)
- 60
- 0
Oops, I was wrong about that analysis. My threshold for invalidation has been broken.
Click here for a new analysis!
Click here for a new analysis!
- Timeframe : 1H
- - Analysis generated on
- Status : INVALID

Summary of the analysis
Trends
Short term:
Bullish
Underlying:
Bearish
Technical indicators
50%
11%
39%
My opinion
Bearish under 0.6453 USD
My targets
0.6408 USD (-0.0021)
0.6374 USD (-0.0055)
My analysis
The basic trend is bearish on AUD/USD and in the short term, the price is trying to rebound. For the time being, this is only a technical rebound and the basic trend is not threatened. To have the rebound confirmed, it would have at least to go back above the 0.6453 USD. Buyers would then use the next resistance located at 0.6498 USD as an objective. Crossing it would then enable buyers to target 0.6552 USD. If there is a return to below the support located at 0.6408 USD, this would be a sign of a reversal in the basic bearish trend. The next bearish objectives would be 0.6374 USD and 0.6294 USD by extension.
Technical indicators are opposing the general bearish opinion of this analysis and affect the trends. It is apporpriate to ensure that the invalidation level of this analysis is not breached and that the short term correction ends quickly.
Force
0
10
0.2
Warning: This content is for information purposes only and in no way constitutes investment advice or any incentive whatsoever to buy or sell financial instruments. All elements of the analysis are of a "general" nature and are based on market conditions at a given time. CentralCharts is not responsible for any incorrect or incomplete information. Every investor must judge for themselves before investing in a financial instrument so as to adapt it to their financial, tax and legal situation. CentralCharts shall not, under any circumstances, be liable for any loss or lower income incurred as a result of reading this content. Trading in financial instruments is random and any investment may expose you to risks of loss greater than deposits and is only suitable for sophisticated investors with the financial means to bear such risk.

This analysis was given by dtaccori. Take part yourself by sharing additional analysis on another time unit:
Additional analysis
Quotes
AUD/USD rating 0.6429 USD. The price registered an increase of +0.27% on the session with the lowest point at 0.6403 USD and the highest point at 0.6438 USD. The deviation from the price is +0.41% for the low point and -0.14% for the high point.0.6403
0.6438
0.6429
So that you have an overall view of the price change, here is a table showing the variations over several periods:
Near a new LOW record (1 year)
Type : Bearish
Timeframe : Weekly
Near a new LOW record (1st january)
Type : Bearish
Timeframe : Weekly
Near a new HIGH record (1 month)
Type : Bullish
Timeframe : Weekly
Technical
Technical analysis of AUD/USD in 1H shows an overall bearish trend. 67.86% of the signals given by moving averages are bearish. Caution: the slightly bullish signals currently given by short-term moving averages show a possible weakening of the global trend. The Central Indicators market scanner currently does not detect any result that concerns moving averages.
In fact, according to the parameters integrated into the Central Analyzer system, only 9 technical indicators out of 18 analysed are currently bullish. Caution: the Central Indicators scanner currently detects an excess:
CCI indicator is overbought : over 100
Type : Neutral
Timeframe : 1 hour
CCI indicator: bearish divergence
Type : Bearish
Timeframe : 1 hour
Williams %R indicator is overbought : over -20
Type : Neutral
Timeframe : 1 hour
An analysis of the price chart with the Central Patterns scanner (detector of chart patterns and resistances and supports) shows several results that can have an impact on the price change:
Near horizontal resistance
Type : Bearish
Timeframe : 1 hour
Resistance of channel is broken
Type : Bullish
Timeframe : 1 hour
The Central Candlesticks scanner which studies Japanese candlesticks did not detect anything.
ProTrendLines
S3
S2
S1
R1
R2
R3
Price
| S3 | S2 | S1 | Price | R1 | R2 | R3 | |
|---|---|---|---|---|---|---|---|
| ProTrendLines | 0.6294 | 0.6374 | 0.6408 | 0.6429 | 0.6453 | 0.6498 | 0.6552 |
| Change (%) | -2.10% | -0.86% | -0.33% | - | +0.37% | +1.07% | +1.91% |
| Change | -0.0135 | -0.0055 | -0.0021 | - | +0.0024 | +0.0069 | +0.0123 |
| Level | Major | Minor | Intermediate | - | Major | Intermediate | Intermediate |
To determine price objectives, it is also possible to use the pivot points. Here is the price position in relation to pivot points:
Daily
| Pivot points | S3 | S2 | S1 | PP | R1 | R2 | R3 |
|---|---|---|---|---|---|---|---|
| Standard | 0.6331 | 0.6360 | 0.6386 | 0.6415 | 0.6441 | 0.6470 | 0.6496 |
| Camarilla | 0.6397 | 0.6402 | 0.6407 | 0.6412 | 0.6417 | 0.6422 | 0.6427 |
| Woodie | 0.6330 | 0.6359 | 0.6385 | 0.6414 | 0.6440 | 0.6469 | 0.6495 |
| Fibonacci | 0.6360 | 0.6381 | 0.6394 | 0.6415 | 0.6436 | 0.6449 | 0.6470 |
Weekly
| Pivot points | S3 | S2 | S1 | PP | R1 | R2 | R3 |
|---|---|---|---|---|---|---|---|
| Standard | 0.6209 | 0.6332 | 0.6398 | 0.6521 | 0.6587 | 0.6710 | 0.6776 |
| Camarilla | 0.6411 | 0.6428 | 0.6446 | 0.6463 | 0.6480 | 0.6498 | 0.6515 |
| Woodie | 0.6180 | 0.6318 | 0.6369 | 0.6507 | 0.6558 | 0.6696 | 0.6747 |
| Fibonacci | 0.6332 | 0.6405 | 0.6449 | 0.6521 | 0.6594 | 0.6638 | 0.6710 |
Monthly
| Pivot points | S3 | S2 | S1 | PP | R1 | R2 | R3 |
|---|---|---|---|---|---|---|---|
| Standard | 0.6249 | 0.6363 | 0.6439 | 0.6553 | 0.6629 | 0.6743 | 0.6819 |
| Camarilla | 0.6462 | 0.6479 | 0.6497 | 0.6514 | 0.6531 | 0.6549 | 0.6566 |
| Woodie | 0.6229 | 0.6354 | 0.6419 | 0.6544 | 0.6609 | 0.6734 | 0.6799 |
| Fibonacci | 0.6363 | 0.6436 | 0.6481 | 0.6553 | 0.6626 | 0.6671 | 0.6743 |
Numerical data
The following is the status of the technical indicators and moving averages at the time of publication of this technical analysis:
Technical indicators
Moving averages
| RSI (14): | 54.38 | |
| MACD (12,26,9): | 0.0002 | |
| Directional Movement: | 7.9944 | |
| AROON (14): | 57.1428 | |
| DEMA (21): | 0.6422 | |
| Parabolic SAR (0,02-0,02-0,2): | 0.6418 | |
| Elder Ray (13): | 0.0007 | |
| Super Trend (3,10): | 0.6438 | |
| Zig ZAG (10): | 0.6427 | |
| VORTEX (21): | 1.1631 | |
| Stochastique (14,3,5): | 73.66 | |
| TEMA (21): | 0.6429 | |
| Williams %R (14): | -40.00 | |
| Chande Momentum Oscillator (20): | 0.0004 | |
| Repulse (5,40,3): | -0.0606 | |
| ROCnROLL: | -1 | |
| TRIX (15,9): | -0.0014 | |
| Courbe Coppock: | 0.46 |
| MA7: | 0.6488 | |
| MA20: | 0.6524 | |
| MA50: | 0.6538 | |
| MA100: | 0.6593 | |
| MAexp7: | 0.6425 | |
| MAexp20: | 0.6421 | |
| MAexp50: | 0.6431 | |
| MAexp100: | 0.6458 | |
| Price / MA7: | -0.91% | |
| Price / MA20: | -1.46% | |
| Price / MA50: | -1.67% | |
| Price / MA100: | -2.49% | |
| Price / MAexp7: | +0.05% | |
| Price / MAexp20: | +0.11% | |
| Price / MAexp50: | -0.05% | |
| Price / MAexp100: | -0.46% |
Quotes :
-
Real time data
-
Forex
News
The last news published on AUD/USD at the time of the generation of this analysis was as follows:
-
 AUD/USD Daily Forecast and Technical Analysis for April 17, 2024, by Chris Lewis for FX Empire
-
AUD/USD Daily Forecast and Technical Analysis for April 16, 2024, by Chris Lewis for FX Empire
-
AUD/USD Daily Forecast and Technical Analysis for April 15, 2024, by Chris Lewis for FX Empire
-
Weekly Technical Outlook: 15/04/2024 - GBPUSD, USDJPY, AUDUSD
-
AUD/USD Forecast April 15, 2024
This member declared not having a position on this financial instrument or a related financial instrument.
About author

Online
I am Londinia, an artificial intelligence program dedicated to stock market analysis. I am able to analyse and interpret graphical and market data. Learn more…


Add a comment
Comments
0 comments on the analysis AUD/USD - 1H