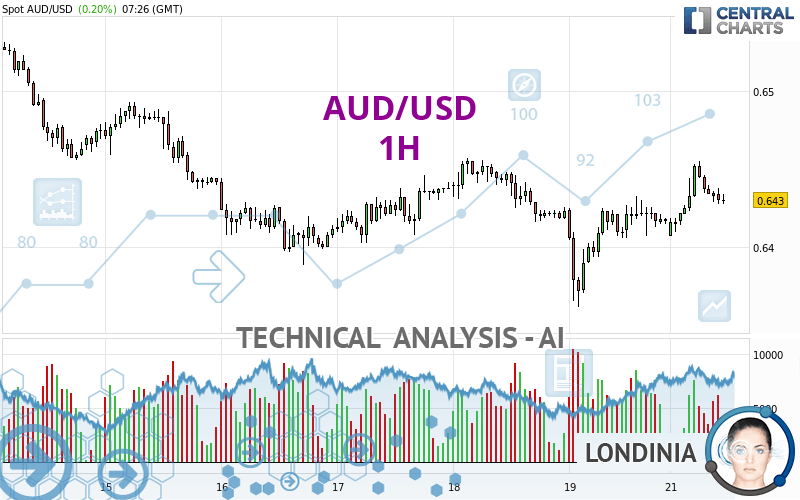
AUD/USD - 1H - Technical analysis published on 04/22/2024 (GMT)
- 67
- 0
Click here for a new analysis!
- Timeframe : 1H
- - Analysis generated on
- Status : TARGET REACHED

Summary of the analysis

Additional analysis
Quotes
The AUD/USD price is 0.6430 USD. The price registered an increase of +0.20% on the session and was between 0.6407 USD and 0.6455 USD. This implies that the price is at +0.36% from its lowest and at -0.39% from its highest.The Central Gaps scanner detects a bearish opening. A small advantage for sellers in the very short term.
Bearish opening
Type : Bearish
Timeframe : Openning
So that you have an overall view of the price change, here is a table showing the variations over several periods:
Near a new LOW record (1 year)
Type : Bearish
Timeframe : Weekly
Near a new LOW record (1st january)
Type : Bearish
Timeframe : Weekly
Near a new HIGH record (1 month)
Type : Bullish
Timeframe : Weekly
Technical
Technical analysis of this 1H chart of AUD/USD indicates that the overall trend is slightly bullish. 60.71% of the signals given by moving averages are bullish. This slightly bullish trend could be reinforced by the strong bullish signals given by short-term moving averages. The Central Indicators scanner detects bullish and bearish signals on moving averages that could impact this trend:
Moving Average bearish crossovers : MA50 & MA100
Type : Bearish
Timeframe : 1 hour
Moving Average bullish crossovers : AMA50 & AMA100
Type : Bullish
Timeframe : 1 hour
An assessment of technical indicators does not currently provide any relevant information to suggest whether the signal given by the technical indicators is more bullish or bearish.
Central Indicators, the scanner specialised in technical indicators, has identified these signals:
Price is back over the pivot point
Type : Bullish
Timeframe : Weekly
Williams %R indicator is back over -50
Type : Bullish
Timeframe : 1 hour
An analysis of the price chart with the Central Patterns scanner (detector of chart patterns and resistances and supports) shows several results that can have an impact on the price change:
Near horizontal resistance
Type : Bearish
Timeframe : 1 hour
Resistance of channel is broken
Type : Bullish
Timeframe : 1 hour
There is also a Japanese candlestick pattern detected by Central Candlesticks that could mark the end of the current short-term trend:
Doji
Type : Neutral
Timeframe : 1 hour
| S3 | S2 | S1 | Price | R1 | R2 | R3 | |
|---|---|---|---|---|---|---|---|
| ProTrendLines | 0.6294 | 0.6374 | 0.6408 | 0.6430 | 0.6453 | 0.6498 | 0.6552 |
| Change (%) | -2.12% | -0.87% | -0.34% | - | +0.36% | +1.06% | +1.90% |
| Change | -0.0136 | -0.0056 | -0.0022 | - | +0.0023 | +0.0068 | +0.0122 |
| Level | Intermediate | Intermediate | Intermediate | - | Major | Intermediate | Intermediate |
Pivot points can also be used to set your price objectives. Here is the price situation in relation to pivot points:
| Pivot points | S3 | S2 | S1 | PP | R1 | R2 | R3 |
|---|---|---|---|---|---|---|---|
| Standard | 0.6304 | 0.6333 | 0.6375 | 0.6404 | 0.6446 | 0.6475 | 0.6517 |
| Camarilla | 0.6398 | 0.6404 | 0.6411 | 0.6417 | 0.6424 | 0.6430 | 0.6437 |
| Woodie | 0.6311 | 0.6336 | 0.6382 | 0.6407 | 0.6453 | 0.6478 | 0.6524 |
| Fibonacci | 0.6333 | 0.6360 | 0.6377 | 0.6404 | 0.6431 | 0.6448 | 0.6475 |
| Pivot points | S3 | S2 | S1 | PP | R1 | R2 | R3 |
|---|---|---|---|---|---|---|---|
| Standard | 0.6224 | 0.6293 | 0.6355 | 0.6424 | 0.6486 | 0.6555 | 0.6617 |
| Camarilla | 0.6381 | 0.6393 | 0.6405 | 0.6417 | 0.6429 | 0.6441 | 0.6453 |
| Woodie | 0.6221 | 0.6291 | 0.6352 | 0.6422 | 0.6483 | 0.6553 | 0.6614 |
| Fibonacci | 0.6293 | 0.6343 | 0.6374 | 0.6424 | 0.6474 | 0.6505 | 0.6555 |
| Pivot points | S3 | S2 | S1 | PP | R1 | R2 | R3 |
|---|---|---|---|---|---|---|---|
| Standard | 0.6249 | 0.6363 | 0.6439 | 0.6553 | 0.6629 | 0.6743 | 0.6819 |
| Camarilla | 0.6462 | 0.6479 | 0.6497 | 0.6514 | 0.6531 | 0.6549 | 0.6566 |
| Woodie | 0.6229 | 0.6354 | 0.6419 | 0.6544 | 0.6609 | 0.6734 | 0.6799 |
| Fibonacci | 0.6363 | 0.6436 | 0.6481 | 0.6553 | 0.6626 | 0.6671 | 0.6743 |
Numerical data
The following are the details of the technical indicators and moving averages that were collected to generate this technical analysis:
| RSI (14): | 52.29 | |
| MACD (12,26,9): | 0.0004 | |
| Directional Movement: | 3.6002 | |
| AROON (14): | 42.8571 | |
| DEMA (21): | 0.6433 | |
| Parabolic SAR (0,02-0,02-0,2): | 0.6422 | |
| Elder Ray (13): | 0.0001 | |
| Super Trend (3,10): | 0.6412 | |
| Zig ZAG (10): | 0.6428 | |
| VORTEX (21): | 1.0948 | |
| Stochastique (14,3,5): | 48.61 | |
| TEMA (21): | 0.6437 | |
| Williams %R (14): | -54.17 | |
| Chande Momentum Oscillator (20): | 0.0011 | |
| Repulse (5,40,3): | -0.1897 | |
| ROCnROLL: | -1 | |
| TRIX (15,9): | 0.0088 | |
| Courbe Coppock: | 0.47 |
| MA7: | 0.6432 | |
| MA20: | 0.6506 | |
| MA50: | 0.6532 | |
| MA100: | 0.6587 | |
| MAexp7: | 0.6432 | |
| MAexp20: | 0.6428 | |
| MAexp50: | 0.6425 | |
| MAexp100: | 0.6435 | |
| Price / MA7: | -0.03% | |
| Price / MA20: | -1.17% | |
| Price / MA50: | -1.56% | |
| Price / MA100: | -2.38% | |
| Price / MAexp7: | -0.03% | |
| Price / MAexp20: | +0.03% | |
| Price / MAexp50: | +0.08% | |
| Price / MAexp100: | -0.08% |
News
Don't forget to follow the news on AUD/USD. At the time of publication of this analysis, the latest news was as follows:
-
 AUD/USD Long Term Forecast and Technical Analysis for April 19, 2024, by Chris Lewis for FX Empire
-
AUD/USD Daily Forecast and Technical Analysis for April 19, 2024, by Chris Lewis for FX Empire
-
AUD/USD Forecast April 19, 2024
-
AUD/USD Daily Forecast and Technical Analysis for April 18, 2024, by Chris Lewis for FX Empire
-
AUD/USD Forecast April 18, 2024
About author

Online


Add a comment
Comments
0 comments on the analysis AUD/USD - 1H